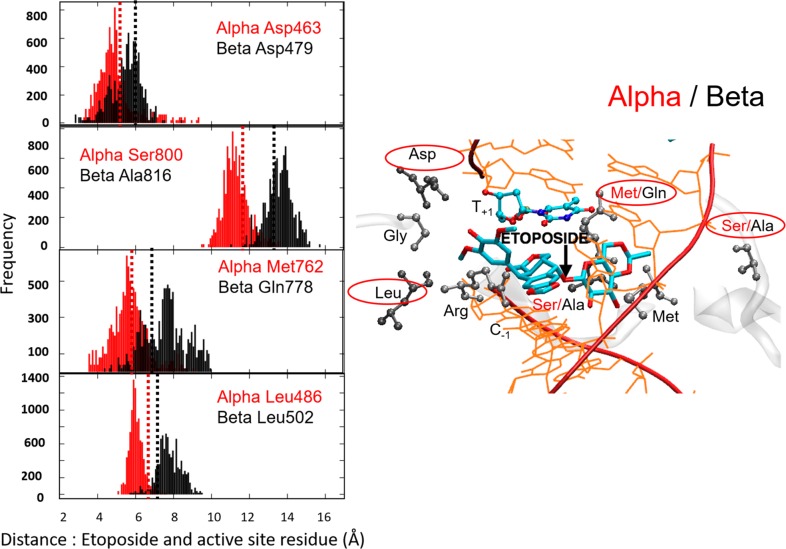
Figure 3.
Plots of the distance between the center of mass (COM) of the etoposide E-ring and COM of Asp463α and Asp479β, Leu486α and Leu502β, and COM of the etoposide sugar moiety and COM of Ser800α and Ala816β, and Met762α and Gln778β, which reflect an enhanced compactness of the active site of the TopoIIα isoform (Figure 2). In the frequency plots, the x-axis indicates the distance of the residues to the ligand. Dashed lines show the corresponding distance in the crystal structure (red, TopoIIα; black, TopoIIβ). For clarity, the plots are shown for four of the ten analyzed residues. These four residues are methionine/glutamine (M762α/Q778β), serine/alanine (S800α/A816β), aspartate (D463α/D479β), and leucine (L486α/L502β). These are chosen in such a way that two of the amino acids are selected from the three known mutations. The residue selection also ensures that interactions with different fragments of the bound ligand are considered. In fact, Ser800α/Ala816β and Met762α/Gln778β are near the sugar moiety of etoposide, whereas Asp463α/Asp479 and Leu486α/Leu502β interact with the E-ring of the drug molecules. The plots of Gly462α/Gly478β, Thr467α/Ser483β, Met766α/Met782β, Ser763α/Ala779β, Ile769α/Val785β, and Arg487α/Arg503β are reported in the Supporting Information.

