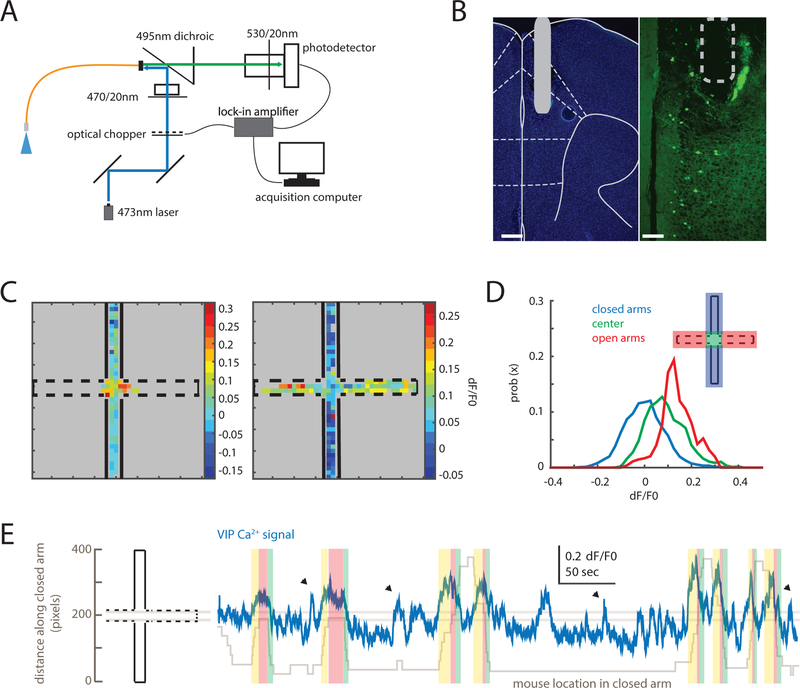
Figure 1. Prefrontal VIP neuron activity reflects elevated plus maze behavior.
(A) Fiber photometry design. An optical fiber delivered 473nm light to mPFC to excite GCaMP6s. GCaMP6s fluorescence was detected and streamed to an acquisition computer using a lock-in amplifier synchronized to an optical chopper.
(B) VIP-Cre mice were injected with AAV-hSyn-FLEX-GCaMP6s. A 400μm optical fiber was implanted with its tip near the prelimbic/infralimbic border (left, DAPI; right, VIP-GCaMP; scale bars: 300 and 90 μm, respectively).
(C) Heatmaps showing the average GCaMP signal from VIP neurons in two individual mice as a function of EPM location. VIP GCaMP signals were highest in the center for a mouse that did not explore the open arms (left); for a mouse that did explore the open arms, VIP GCaMP signals were highest in the open arms (right).
(D) Distributions of VIP-GCaMP signals (dF/F0) in different EPM zones: the closed arms (blue), center zone (green), or open arms (red) (n = 5 mice).
(E) An example trace showing VIP-GCaMP signals during EPM exploration. The VIP-GCaMP signal (blue) is overlaid on top of the position of the mouse along the closed arm axis (gray). Two horizontal lines demarcate the center zone. VIP activity tracks the position of the mouse (yellow, approach towards center zone; red, in center zone; green, exit from center zone). Arrowheads indicate when the mouse was rearing or reorienting within the closed arm.
See also Figures S1 and S2.

