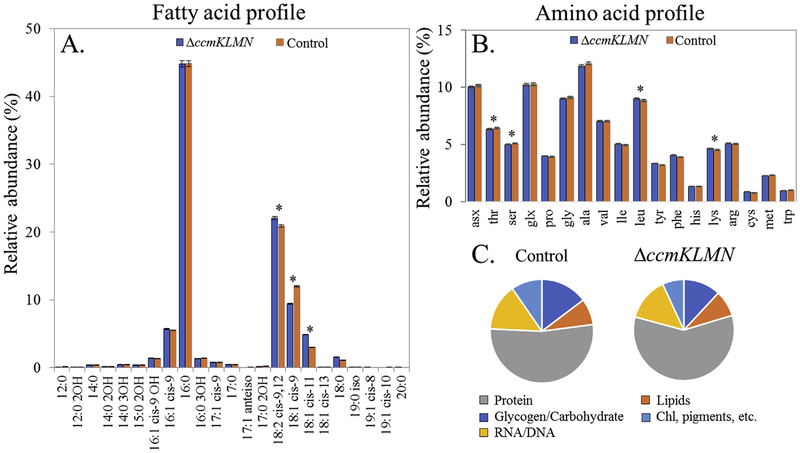
Fig. 2. Biomass compositional analysis of Synechococcus PCC 7002 control and ΔccmKLMN mutant.
(A) Fatty acid profile found in each strain as a relative abundance of the total fatty acid content. (B) Amino acid profile found in each strain as the relative mole percentage. asx: aspartate and asparagine; glx: glutamate and glutamine. (C) Macromolecule biomass composition as a percentage of dry cell weight. * indicates a significant difference (p value < 0.05). Both control and mutant strains were cultivated in high CO2/light conditions.

