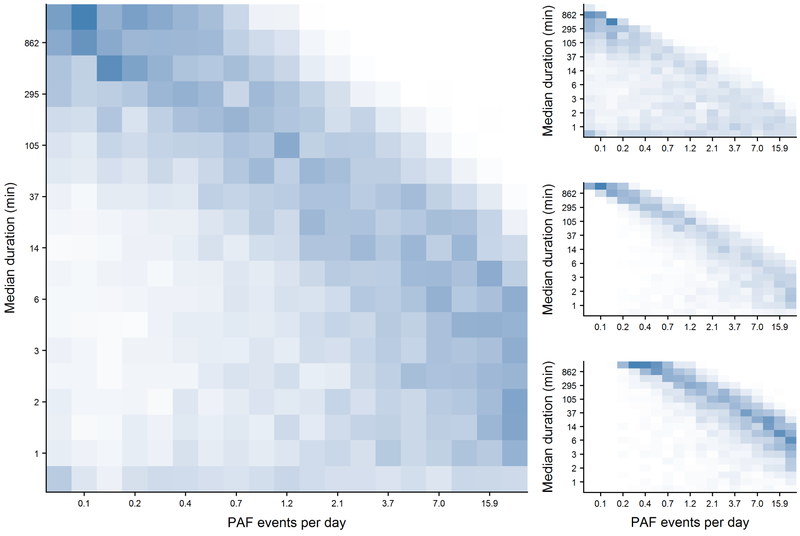
Figure 3.
Heatmaps demonstrating the frequencies of PAF cases based on their daily PAF event rate (x-axis) and median event duration (y-axis). Left panel: all PAF cases; Right panels broken down by AF burden tertiles, Top: low AF burden (less than 4.7%); Middle: moderate AF burden (4.7% to 17.8%); Bottom: high AF burden (greater than 17.8%). Boxes represent every 5 percentile on the corresponding distribution. Individuals in the upper left of each figure display the legato subtype while individuals in the bottom right are staccato.

