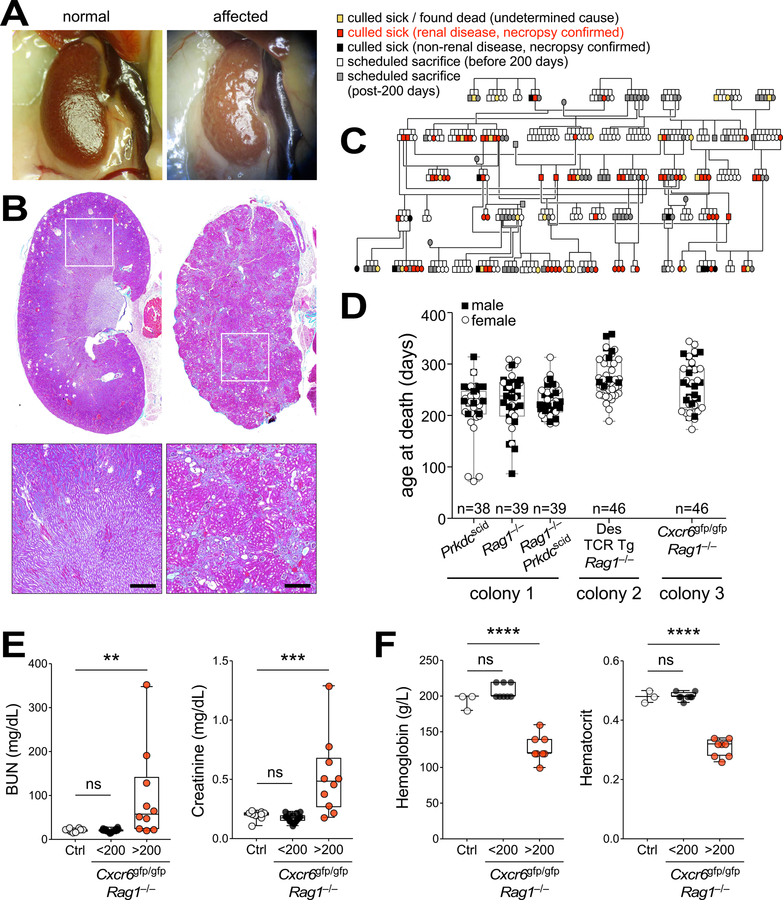
Figure 1. Renal disease in immunodeficient mice.
(A,B) Representative macroscopic images (A) and Milligan’s trichrome staining (B) of normal (left) and disease-affected (right) kidneys. Bar = 500 µm. (C) Necropsy-confirmed renal disease incidence (red) in immunodeficient B6.Cg Prkdcscid/scid generations at the Centenary Institute. (D) Age of death for necropsy-confirmed renal disease in 3 separate colonies of immunodeficient mice housed at the Centenary Institute from 2010–2017. Colony 1: B6.Cg Prkdcscid/scid, B6.Cg Rag1−/− and Prkdcscid/scid Rag1−/− double-knockout mice; Colony 2: Des T cell receptor (TCR) transgenic (Tg) mice crossed to B6.Cg Rag1−/−; Colony 3: Cxcr6gfp/gfp Rag1−/− mice. Male (black boxes) and female (white circles) mice; n = 38–46 as shown. (E,F) Analysis of serum biochemistry (E) or hemoglobin and haematocrit (F) in mouse strains affected by renal disease (Cxcr6gfp/gfp Rag1−/−; <200 days, black, E (n = 20), F (n = 8); >200 days, red, E (n = 10), F (n = 8)) and in unaffected controls (Rag1−/− and C57BL/6 from Australian BioResources (ABR), white, E (n = 10), F (n = 3)). Each dot represents an individual mouse. BUN, blood urea nitrogen. **P = 0.04, ***P = 0.002, ****P < 0.0001 (one-way ANOVA, Holm-Sidak’s multiple comparison). See also Fig. S1.

