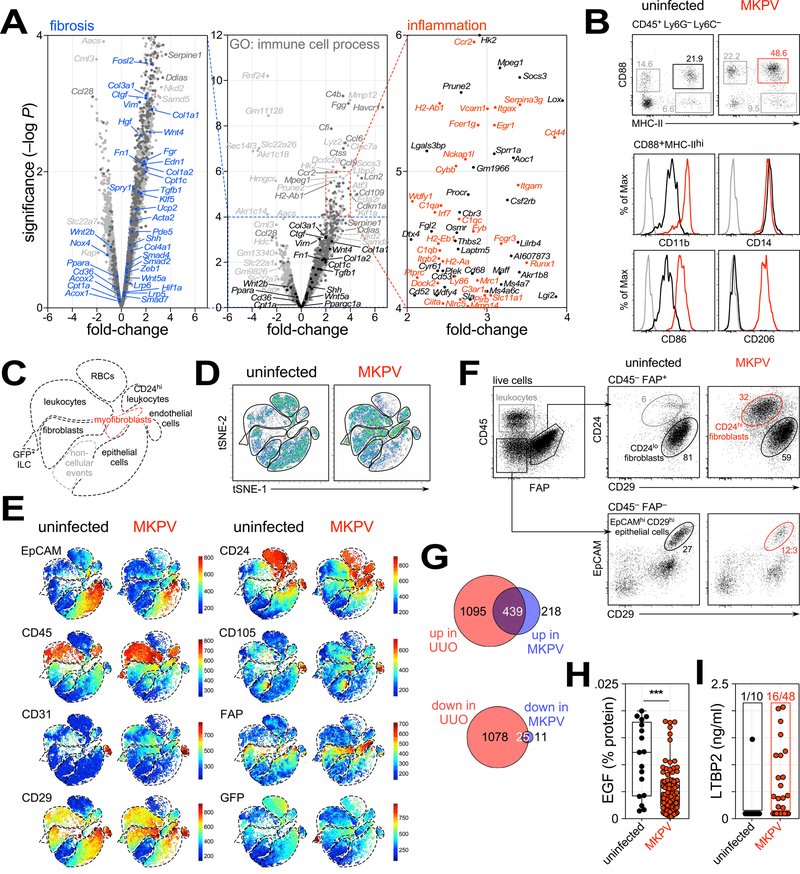
Figure 6. Molecular and cellular changes with MKPV infection.
(A) Comparison of gene expression in healthy kidneys (n = 2 replicates) vs. MKPV-infected kidneys (n = 2) by volcano plot. Selected genes implicated in TGFβ signalling and fibrosis are marked in black (centre) and blue (left). Genes implicated in immune system processes (GO: 0002376) are marked in red (right) or dark grey (middle). (B) Top: Flow cytometry dotplots identifying CD88+ MHC-II+ macrophages isolated from kidneys of uninfected Rag1−/− (left) and MKPV-infected Cxcr6gfp/gfp Rag1−/− mice (right). Bottom: cell surface expression of markers on these macrophages; black, controls; red, MKPV-infected; grey, fluorescence-minus-one controls. (C,D,E) tSNE plots of flow cytometry data from live (DAPI−) cells isolated from uninfected Rag1−/− and MKPV-infected Cxcr6gfp/gfp Rag1−/− mice. (C) Schematic defining populations in D & E. (E) Relative expression of markers. (F) Flow cytometry dotplots of myofibroblast conversion and epithelial cell loss. Left: CD45+ leukocytes and FAP+ fibroblasts isolated from normal kidneys. Top right: CD24 (heat-stable antigen) and CD29 (β1 integrin) expression by FAP+ fibroblasts from unaffected and IBN kidneys. Red gate: CD24+ CD29lo myofibroblasts. Bottom: EpCAM (epithelial cell adhesion molecule) and CD29 expression by CD45− FAP− cells. Black & red gates identify EpCAMhi CD29+ epithelial cells. Representative of 3 independent experiments. (G) Venn diagrams depicting the numbers of genes highly (>log2 1.5-fold) up- (top) or down-regulated (bottom) in unilateral ureteral obstruction (UUO) (Arvaniti et al., 2016) and MKPV IBN. Colours denote genes unique to UUO (red), MKPV (blue) or shared (purple). (H,I) Urinary EGF (H) and LTBP2 (I) levels in uninfected wild-type and Rag1−/− mice (black; n = 17 in H, n = 10 in l) and MKPV-infected Cxcr6gfp/gfp Rag1−/− mice (red; n = 66 in H, n = 48 in I). ***P = 0.0004 (unpaired t-test). See also Fig. S7 and Table S2.

