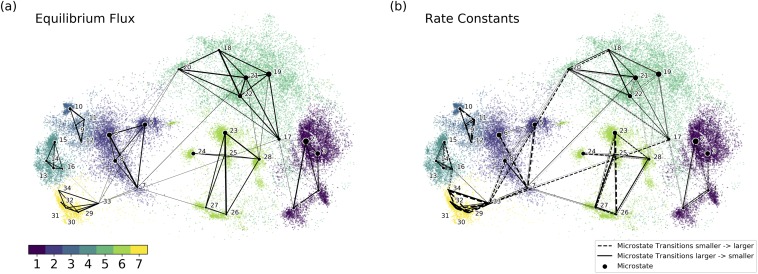
FIG. 3.
Established DKTN model based on microstates: (a) the equilibrium flux between microstates in the equilibrium; (b) the rate constants between microstates. A dashed line represents the transitions from a microstate with a smaller ID number to a microstate with a larger ID number. A solid line represents opposite transition comparing to the dashed line. The width of the line represents the magnitude of the reaction rate constant (the bolder and the larger).

