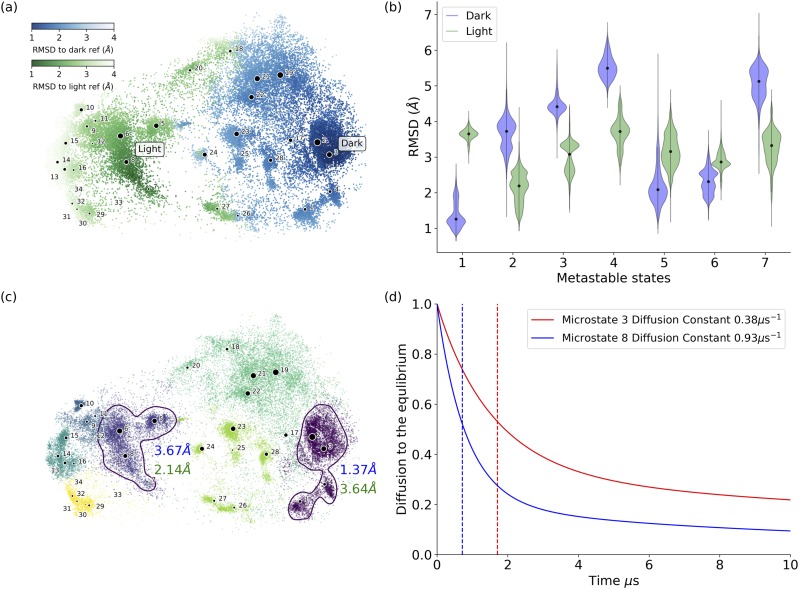
FIG. 4.
Distributions of RMSD values with reference to VVD dark and light structures for microstates and metastable states. (a) The RMSD value distribution on the t-SNE projection surface. The darker color indicates the smaller RMSD values. (b) Violin plots of the averaged RMSD values of each metastable state with reference to VVD crystal dark and light structures, respectively. Among all metastable states, state 1 (comprising microstates 1, 2, 3, and 4) has the lowest averaged RMSD value with reference to the crystal dark structure as 1.37 Å, and state 2 (comprising microstates 5, 6, 7, and 8) has the lowest averaged RMSD value with reference to the crystal light structure as 2.14 Å. (c) Distribution of metastable states illustrated in different colors. The nearest metastable states closest to either the dark or the light structures are highlighted by circles. Metastable state 1 circled at the right-hand side (comprising microstates 1, 2, 3, and 4) is the closest to the crystal dark structure. Metastable state 2 circled at the right-hand side (comprising microstates 5, 6, 7, and 8) is the closest to the crystal light structure. The averaged RMSD values of metastable states 1 and 2 with reference to the crystal dark and light structures are also labeled in color (blue: RMSD to crystal dark structure, green: RMSD to crystal light structure). (d) Diffusion time to equilibrium for simulations starting from microstate 3 (as VVD dark state) and microstate 8 (as VVD light state), respectively. The plot shows that the system could reach equilibrium faster when starting from the light state than starting from the dark state.

