Figure 2.
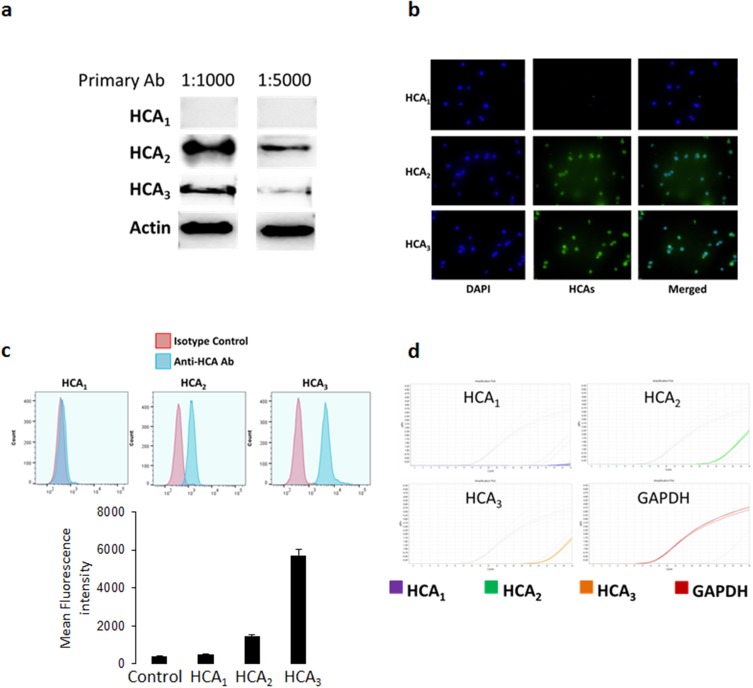
Expression of HCA receptors in NK92 cells. (A) Western blotting was performed on NK92 cell lysates incubated with primary antibodies for HCA1, HCA2, and HCA3 at two different concentrations (1:1000 and 1:5000). (B) Immunofluorescence staining of NK92 cells with specific antibodies for each HCA receptors. Green fluorescence showing binding of the anti-HCA antibodies, whereas blue fluorescence (DAPI staining) shows nuclear staining of the cells, and merged figures showing two images superimposed to each other for each HCA receptor. (C) Flow cytometry showing the expression of HCA1, HCA2, and HCA3. Red histograms showing the binding of the isotype control antibody, whereas blue histograms showing binding of the anti-HCA antibodies. (D) PCR data showing the mRNA expression of HCA receptors in NK92 cells. GAPDH mRNA expression was used as an internal control.

