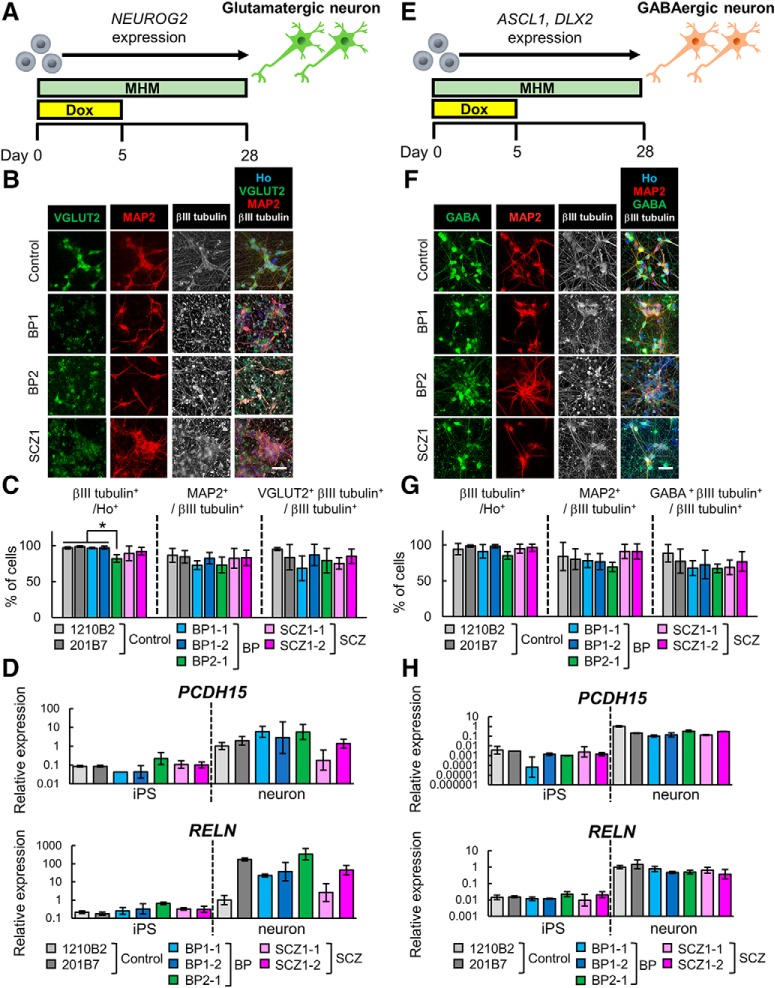
Figure 3.
Neuron differentiation by transcription factor overexpression. A, Overview of the protocol for differentiation into glutamatergic neurons. B, Immunocytochemical analysis of neuronal markers (VGluT2, MAP2, and βIII tubulin). Scale bar, 40 μm. C, Ratio of positive cells for each marker; βIII tubulin+ cells/all cells (βIII tubulin+/Ho+), MAP2+ cells/βIII tubulin+ cells (MAP2+/ βIII-tubulin+), and VGluT2 and βIII tubulin double+ cells/βIII tubulin+ cells (VGLUT2+βIII tubulin+/βIII tubulin+). (n = 3-6 independent experiments; mean ± SD; *p < 0.05; Tukey’s test, the population of βIII tubulin+ cells in BP2-1-derived neurons was significantly lower than those in 1210B2-, 201B7-, BP1-1-, and BP1-2-derived neurons). D, Relative gene expression levels of PCDH15 (primer set1) and RELN in NEUROG2-transduced iPSCs and induced neurons (n = 3 independent experiments; mean ± SD; Dunnett’s test among iPSCs and among neurons, no significant differences were observed). Values were normalized to that for 1210B2-derived neurons, which was considered to be 1.0. Some iPSC samples, in which PCDH15 expression was under the detection limit, were removed from the analysis. Specifically, two samples of BP1-1, and one sample of 1210B2, 201B7, BP2-1, and SCZ1-1 were excluded from the analysis. E, Overview of the protocol for differentiation into GABAergic neurons. F, Immunocytochemical analysis of neuronal markers (MAP2, GABA, and βIII tubulin). Scale bar, 40 μm. G, Ratio of positive cells for each marker; βIII tubulin+ cells/all cells (βIII tubulin+/Ho+), MAP2+ cells/βIII tubulin+ cells (MAP2+/βIII tubulin+), and GABA and βIII-tubulin double-positive cells/βIII tubulin+ cells (GABA+βIII tubulin+/βIII tubulin+). (n = 3-6 independent experiments; mean ± SD; Tukey’s test; no significant differences were observed). H, Relative gene expression levels of PCDH15 and RELN in ASCL1- and DLX2-transduced iPSCs and induced neurons. (n = 3 independent experiments; mean ± SD; Dunnett’s test among iPSCs and among neurons; no significant differences were observed). Values were normalized to that for 1210B2-derived neurons, which was considered to be 1.0. Some iPSC samples, in which PCDH15 expression was under the detection limit, were removed from the analysis. Specifically, each one sample of 1210B2 and BP2-1 was excluded from the analysis.

