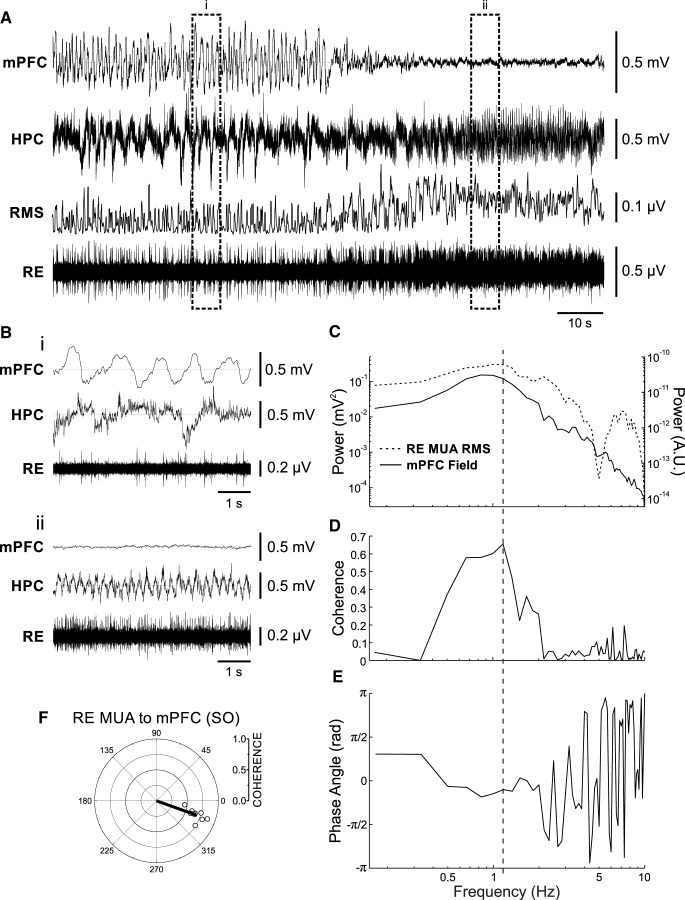
Figure 2.
RE MUA is phase coupled to the forebrain SO. A, Simultaneous field recordings in mPFC and HPC, with glass micropipette multiunit recording in RE, with rms envelope (200 ms window, slid by 50 ms) of RE multiunit recording above, during a spontaneous deactivated-to-activated field state change. Bracketed segments correspond to expansions in B, which highlight the features of field and RE unit activity across states. Bi, Deactivated (SO) state showing a slow, rhythmic firing of representative RE multiunit activity, coupled to the negative phase of the mPFC SO. Bii, Activated (theta) state illustrating tonic firing of RE units. C, Autospectral power of mPFC field (black line, left axis) and of the rms envelope of RE MUA (dashed black line, right axis) during SO. D, E, Coherence (D) and phase spectra (E) across the two signals shown in C. Vertical dashed line through C–E indicates SO frequency extracted from spectra. F, Circle plot of preferred phase as measured by coherence (radia) and phase angles (°) obtained from spectra of RE multiunit activity compared to the mPFC SO cycle. Shaded gray circle corresponds to the multiunit activity illustrated in all panels of this figure.

