Figure 3.
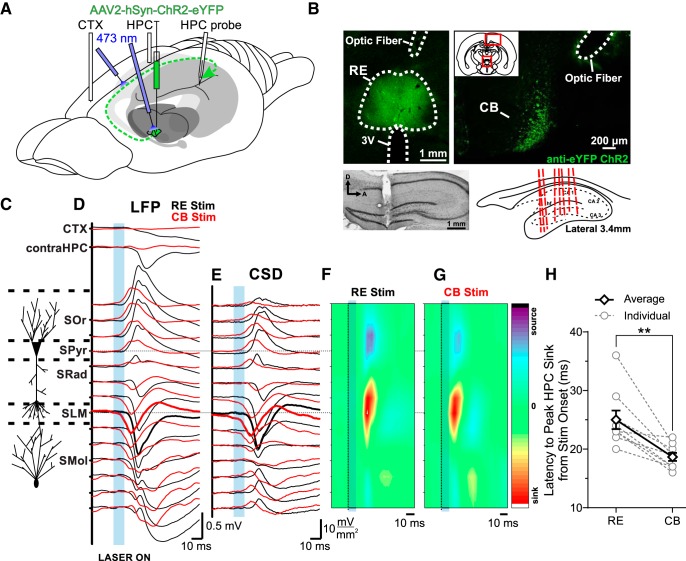
Optogenetic stimulation of the RE/CB reliably produces an evoked potential in the HPC. A, Schematic illustration of the injection, stimulation, and recording procedures. Schema modified from Amaral and Witter (1995). B, Top left, Representative coronal tissue section showing the expression of hSyn-ChR2-EYFP virus localized to RE, with optic fiber track positioned dorsal to RE. Top right, hSyn-ChR2-EYFP viral expression in the CB from a single injection into RE, with optic fiber track. Inset, Schematic of relative locations of top two images. Bottom left, Nissl-stained sagittal section of HPC illustrating multiprobe track penetrating cell lamina perpendicularly. Bottom right, Schematic sagittal illustration of all (except one) multiprobe tracks through the HPC. C, Schematic depiction of HPC cell lamina as determined by theta profiles. D, Local field potentials evoked in frontal CTX, contralateral HPC, and in the ipsilateral HPC via the multiprobe. Laser light delivery (10 ms pulse at 473 nm wavelength; blue rectangle) to the RE (black lines) produced a response in CTX and contralateral HPC, as well as a profile that reversed from dorsal-to-ventral locations through the ipsilateral CA1 region of the HPC, with a maximal amplitude at a depth corresponding to SLM (which was also the power maximum of the SO and theta profiles). Identical stimulation of the CB (red lines) produced a similar but lower latency profile in ipsilateral HPC, but largely eliminated the evoked response in CTX and contralateral HPC, indicative of the specificity of the ipsilateral RE pathway through the CB. E, Current sink/source density line plots illustrating net synaptic current flow at each ipsilateral hippocampal recording site, showing a maximal sink at SLM following both RE (black) and CB (red) stimulation (sinks are shown by downward or negative deflections, sources by upward or positive deflections). F, G, Color contour plot of the CSD traces in E following RE (F) and CB (G) stimulation (marked by a dashed line and blue box), depicting a large sink centered on SLM, with a corresponding source in basilar regions of CA1. CSD scales are −17 to 17 mV/mm2 for RE stimulation, and −11 to 11 mV/mm2 for CB stimulation. H, Latency from the end of the 10 ms optical stimulation to peak HPC sink, which in every case was at SLM, for individual animals (gray hollow circles and dashed gray lines), and on average (black hollow diamonds and solid black lines). Error bars represent SEM. (**p < 0.01). SOr, Stratum oriens; SPyr, stratum pyramidale; SRad, stratum radiatum; SMol, stratum moleculare.

