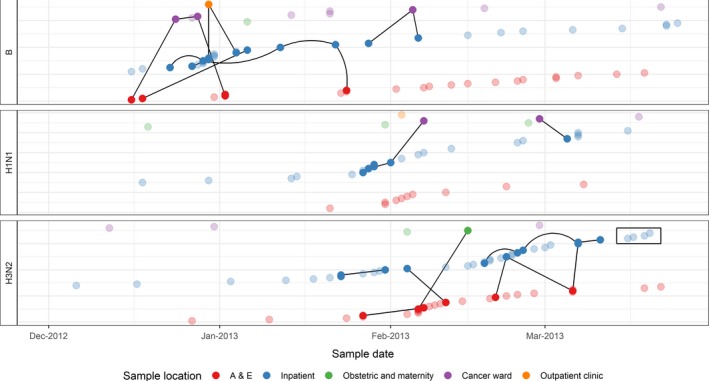
Figure 2.

Space‐time links between cases of influenza, University College London Hospitals NHS Foundation Trust, 2012‐2013 (n = 183). Dots show cases on the date of their first positive influenza specimen. Solid dots indicate cases that were part of genetic clusters, and transparent dots were not clustered. Black lines indicate genetic links between cases. The colour of the marker indicates the hospital area where the sample was taken. The rectangle highlights a group of cases for which transmission may have been suspected based on time and place of sampling, but is not indicated by genetic data. In this figure, only the cases H1N1 cases in the Inpatient ward were sufficiently close in time to be classified as having space‐time links
