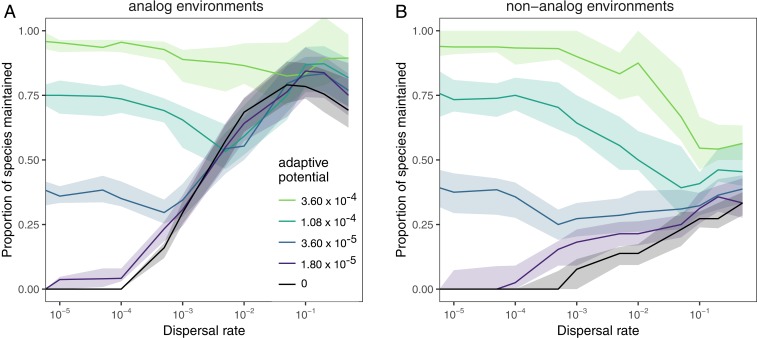
Fig. 2.
The proportion of species that are maintained following environmental change depending on dispersal and adaptive potential (color). The proportion of species maintained was calculated as the number of species that were present in the region (A, analog or B, nonanalog) after environmental change, divided by the number of species that were present before. Therefore, species that were only present in analog patches would not be included in the nonanalog diversity. The lines show the median value across 50 replicate simulations with standard parameter values (SI Appendix, Table S1) and the bands show the interquartile range. This figure shows patterns for regional scale diversity. Local scale patterns are shown in SI Appendix, Fig. S9.

