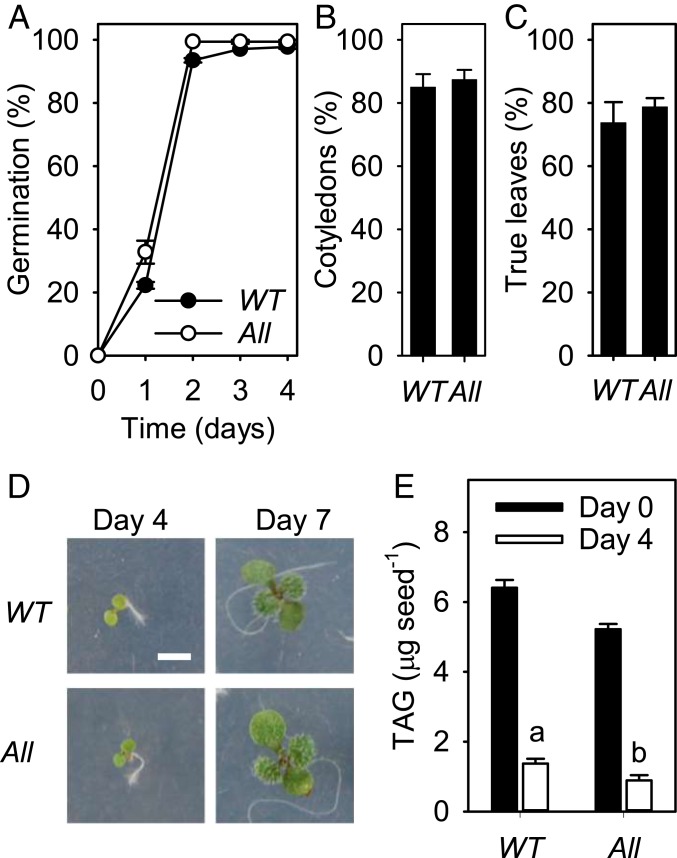
Fig. 5.
Effect of genetic modifications on seed vigor at 20 °C. Percentage (A) seed germination, (B) cotyledons expanded by day 4, and (C) true leaves developing by day 7. (D) Representative images of seedlings with expanded cotyledons and developing true leaves. (E) Seed/seedling TAG content at days 0 and 4. WT, wild type; All, ProGLY:∆CTS-LPAT1 lpat2-3 pdct. Values are the mean ± SE of measurements made on separate seed batches from 3 plants of each genotype (n = 3). In D, Scale bar, 2 mm. a and b denote values significantly (P < 0.05) different from WT (2-tailed Student’s t tests).

