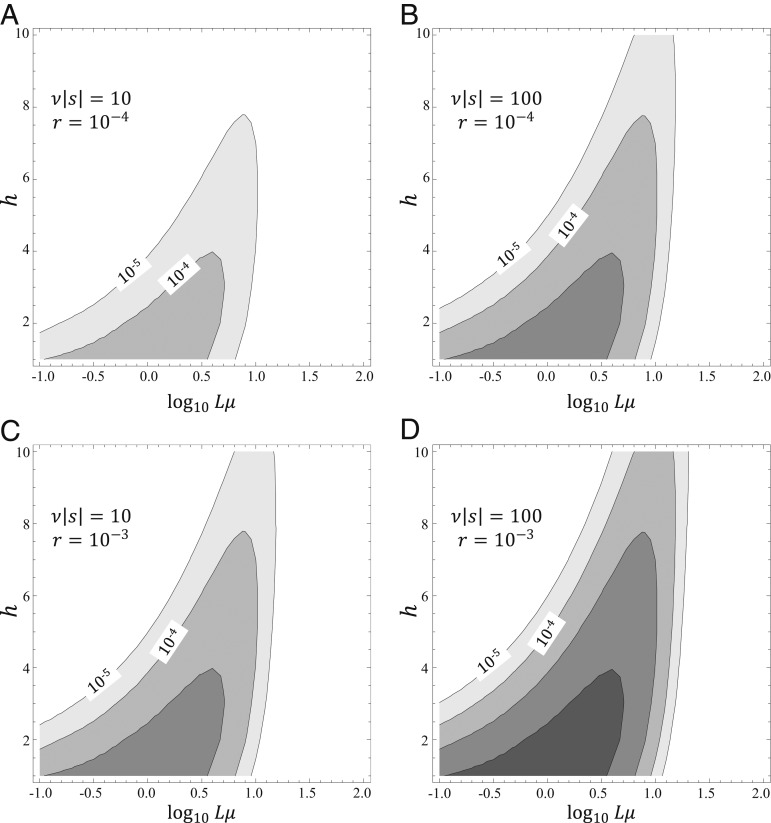
Fig. 3.
Rates of leaps on a landscape combining beneficial and deleterious mutations. Rates of leaps are plotted against the per-genome mutation rate (Lμ) and the leap length for different strengths of selection (A and C: ν|s| = 10; B and D: ν|s| = 100) and for different frequencies of beneficial mutations (A and B: r = 10−4; C and D: r = 10−3). Contour lines indicate orders of magnitude and start from the rate of 10−5 leaps per generation.

