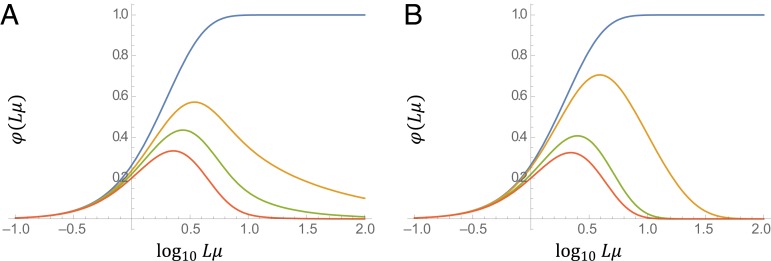
Fig. 4.
Abundance of beneficial multimutation combinations depending on the mutation rate. Abundance of beneficial multimutation combinations, , given by Eq. 24, relative to . (A) with (blue), (orange), (green), and (red). (B) de with (blue), (orange), (green), and (red).

