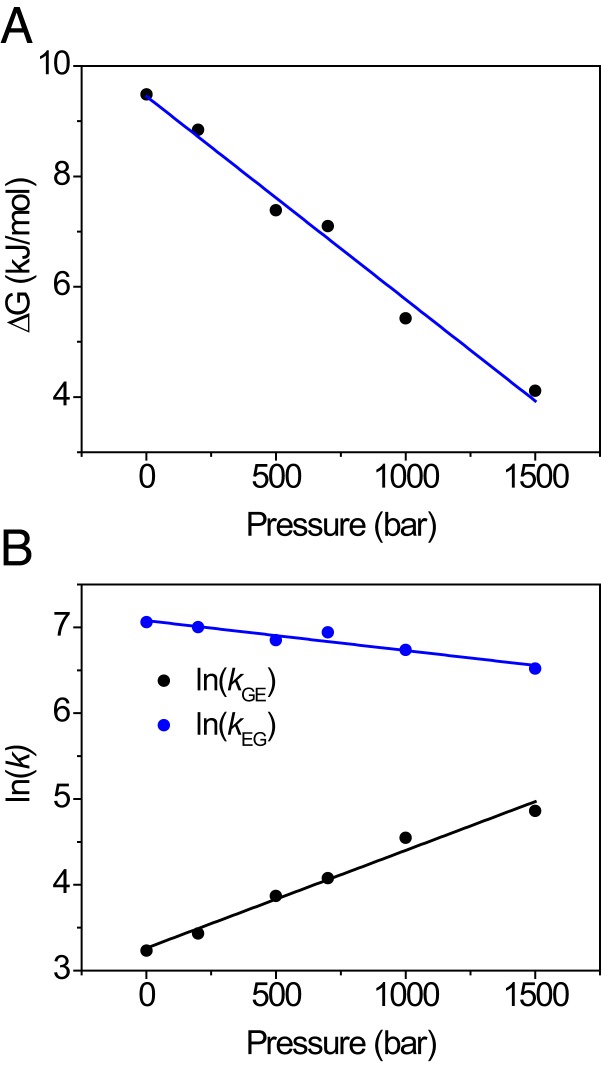
Fig. 4.
Structure relaxation of L99A followed by relaxation dispersion NMR spectroscopy. (A) Decrease of ΔGGE with pressure indicates that E becomes increasingly populated; (B) forward (kGE) and reverse (kEG) rate constants with pressure show that the exchange rate kex = kGE + kEG decreases with pressure. Global fitting yields activation volumes ΔVGE0‡ = −28 ± 2 mL/mol, ΔVEG0‡ = 9 ± 1 mL/mol, and ΔVGE0 = −37 ± 2 mL/mol.

