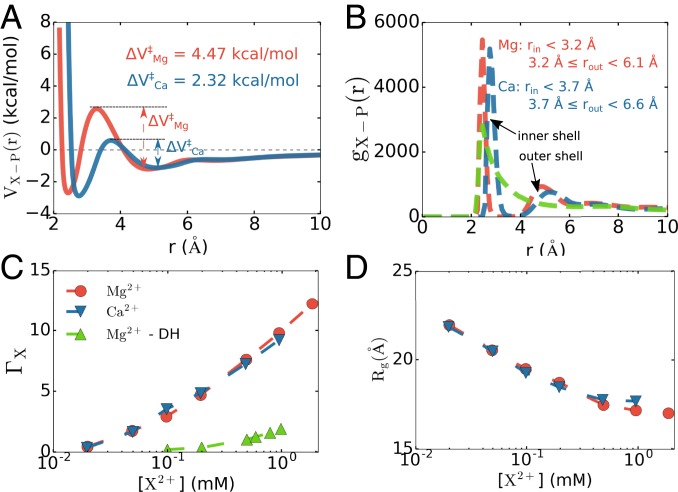
Fig. 7.
Comparison between Mg2+ and Ca2+ binding to phosphate groups and RNA. (A) Effective potentials for Mg2+ and Ca2+ with the phosphate group show that the transition barrier between inner-shell–outer-shell coordination for Ca2+ is considerably lower than for Mg2+. However, the depths of the inner- and outer-shell minima are comparable. (B) Radial distribution function between the ions and phosphate groups in BWYV. Also shown are the results for Mg2+ ions in which Mg2+–phosphate interactions are modeled using the Debye–Hückel potential (green). (C and D) Preferential interaction coefficient (C) and radius of gyration (D) computed for 58-nt rRNA. Only data for 150 mM KCl are presented here; data for other KCl concentrations can be found in SI Appendix, Fig. S6. The rRNA reaches its native states at high divalent ion concentrations using our model, but does not easily fold at any Mg2+ concentration should the Debye–Hückel potential be used.

