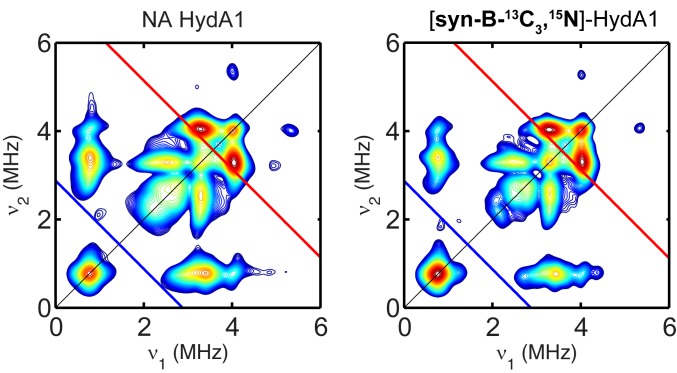
Fig. 4.
Comparison of X-band HYSCORE spectra of a CrHydA1 and CrHydA1 maturated from syn-B-13C3,15N collected at g = 2.102 (g1 of Hox). The Larmor frequencies of 13C and 15N are indicated in both spectra by red and blue lines, respectively. Conditions were as follows: frequency = 9.8 GHz; temperature = 15 K; τ = 140 ns; π/2 pulse = 12 ns.

