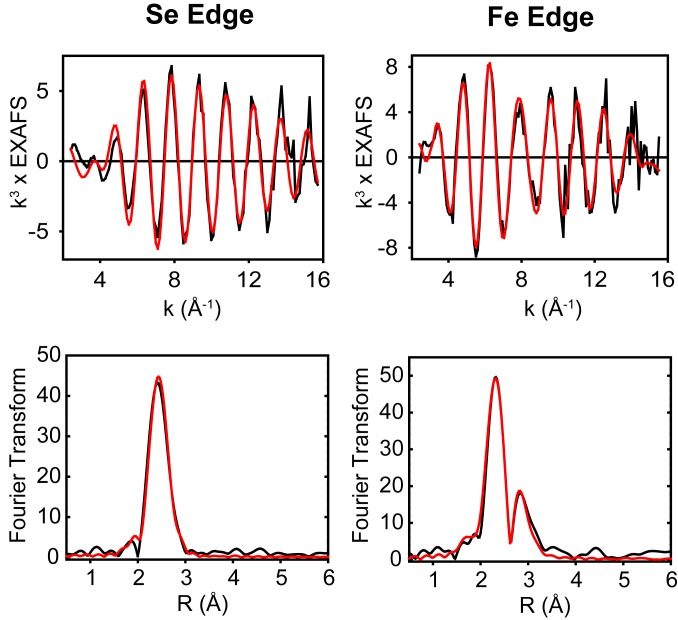
Fig. 5.
Se K-edge (Left) and Fe K-edge (Right) EXAFS (Upper) and the corresponding Fourier transforms (Lower) of the Se-labeled CrHydA1. Black traces are experimental data and red traces are simulations using the parameters listed in SI Appendix, Table S2.

