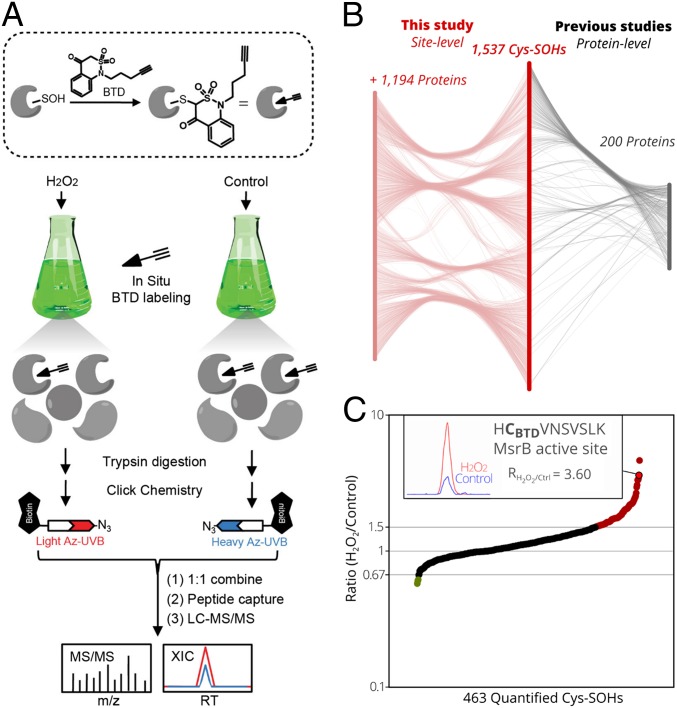
Fig. 1.
Quantitative Cys-SOH identification in Arabidopsis. (A) Workflow for in vivo S-sulfenylation labeling and analysis in Arabidopsis cell cultures. The BTD-based probe was sketched as an arrow (chemical warhead) followed by 3 lines indicating the alkyne handle. (B) Mapping of the 1,537 identified Cys-SOHs sites on 1,394 (Araport11) proteins, of which 200 proteins were identified to be S-sulfenylated previously (17–19) (Right) and 1,194 were discovered as protein targets (Left) (Dataset S1). (C) Ratios (RH2O2/Control, y axis) plotted for 463 Cys-SOH sites quantified in at least 2 out of 3 replicates (x axis). Ratios of at least 1.5-fold increases (red, 92 Cys-SOHs) or decreases (green, 3 Cys-SOHs) are shown. (Inset) For the catalytic Cys of MsrB3/7/8/9 (encircled in bold), the extracted-ion chromatogram is displayed (H2O2/light in red, and control/heavy in blue).

