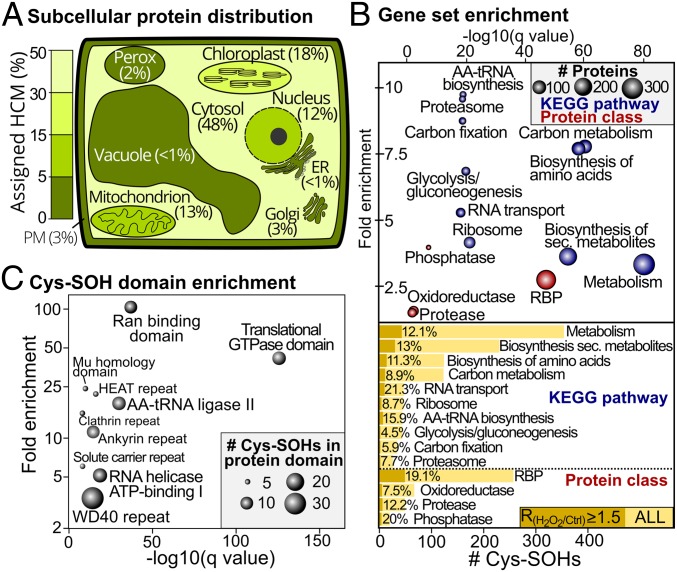
Fig. 2.
Subcellular localization distribution and functional enrichment of S-sulfenylation events. (A) Subcellular distribution of 809 S-sulfenylated proteins defined as high-confidence markers (HCMs) by the Multiple Marker Abundance Profiling tool (28, 29). Organelles are colored proportionally to the S-sulfenylated HCMs. (B) Gene set enrichment of S-sulfenylated proteins for KEGG pathways (blue) and custom protein classes (SI Appendix, Materials and Methods) (Top). Fold enrichment (y axis) is plotted as a function of statistical significance (minus log Q value, x axis). Node size corresponds to the number of S-sulfenylated proteins. Bar chart outlining the number of Cys-SOHs for the enriched KEGG pathways and protein classes (Bottom). Induced Cys-SOHs (RH2O2/Ctrl ≥ 1.5) are plotted, and their respective proportion is displayed. (C) Cys-SOH domain enrichment (SI Appendix, Materials and Methods). Fold enrichment (y axis) is plotted as a function of statistical significance (minus log Q value, x axis). Node size is scaled to the number of Cys-SOHs. ER, endoplasmic reticulum; PM, plasma membrane.

