Fig. 6.
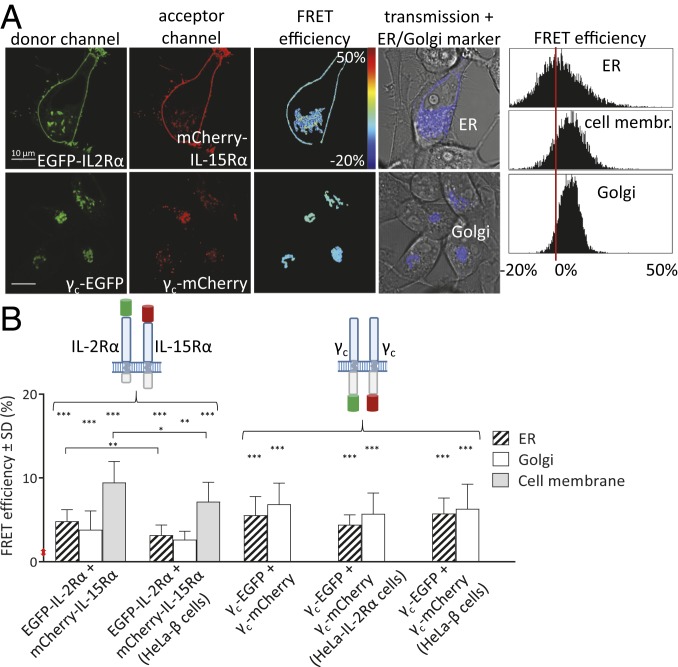
FRET microscopy measurements demonstrating the heteroassociation of IL-2Rα and IL-15Rα and the homoassociation of γc subunits. (A) Confocal microscopic FRET results measured between IL-2Rα and IL-15Rα subunits N-terminally tagged with EGFP (donor) and mCherry (acceptor) are shown for representative cells (A, first row). Measurements were carried out in HeLa cells as well as in HeLa-β cells expressing the nontagged IL-2/15Rβ subunit (shown in B). Association of C-terminally tagged γc-chains was measured in HeLa (A, second row) as well as in HeLa-IL2Rα and HeLa-β cell lines (B). (B) Average FRET efficiencies (±SD) are shown. The red arrow on the ordinate axis marks the range of the 3 negative control samples, E = 0.4 to 1.5%. Significant differences compared to negative control 1 (or between HeLa and HeLa-β cells) are indicated by the following: *P < 0.05, **P < 0.01, and ***P < 0.001 (Student’s t test). FRET efficiencies and the numbers of cells measured for each sample are also summarized in Table 1.

