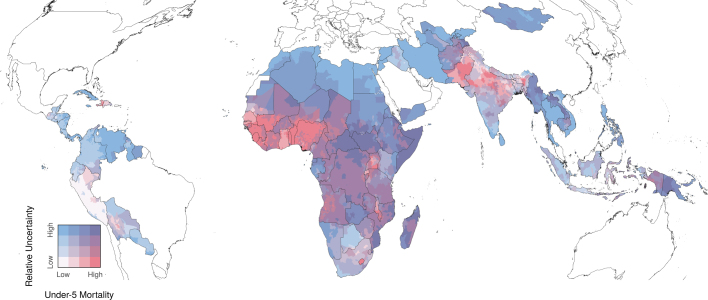
Extended Data Fig. 3. Relative uncertainty in U5MR estimates for 2017.
Relative uncertainty in second administrative-level estimates compared with mean estimated U5MRs in each second administrative-level unit for 2017. Mean rates and relative uncertainty are split into population-weighted quartiles. These cut-off points indicate the relative uncertainty minimum, 25th, 50th and 75th percentiles, and maximum, which are 0.29, 0.51, 0.63 and 0.86, and 3.12, respectively. The under-5 mortality minimum, 25th, 50th and 75th percentiles, and maximum are 1.4, 13.0, 22.9 and 44.8, and 190.6 deaths per 1,000 live births. Areas in which our estimates are more uncertain are coloured with a scale of increasing blue hue, whereas areas in which the mean estimates of U5MR are high are coloured with a scale of increasing red hue. Purple areas have high, but uncertain, estimates of U5MRs. White areas have low relative mortality, with fairly certain estimates. Relative uncertainty is defined as the ratio of the width of the 95% uncertainty interval to the mean estimate.

