Fig. 3.
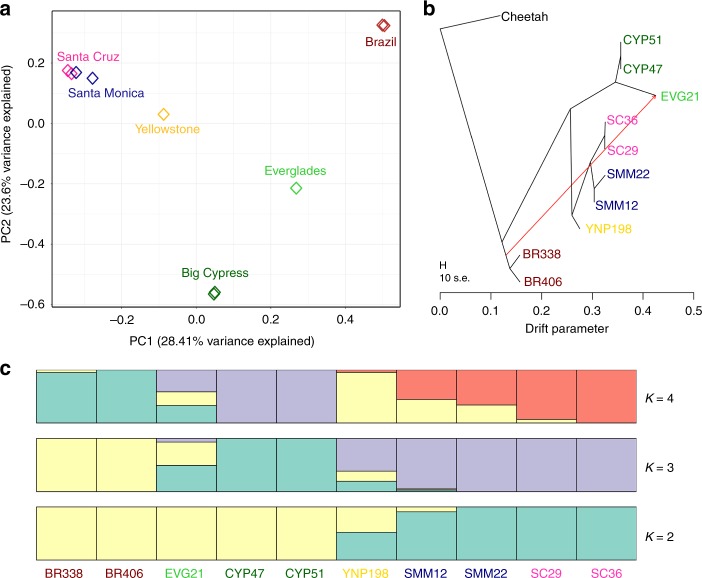
Stratification of pumas based on the geographic population. a Principal component analysis of 166,037 sites separates the sampled pumas based on population. The first component primarily separates South and North American pumas, while the second component distinguishes the variation within North America. All California pumas (Santa Cruz and Santa Monica) cluster closely. b TreeMix62 analysis, using the African cheetah as the outgroup, indicates the best tree separates pumas based on population and includes one migration event (weight = 0.453911) from the branch of South American diversity into the admixed Everglades puma (EVG21). c The mean of ten permuted matrices of STRUCTURE63 analysis for each of K = 2 through 4, performed using CLUMPP64. Both delta K and L(K) values indicated that K = 3 was the best K (Supplementary Fig. 10)65.

