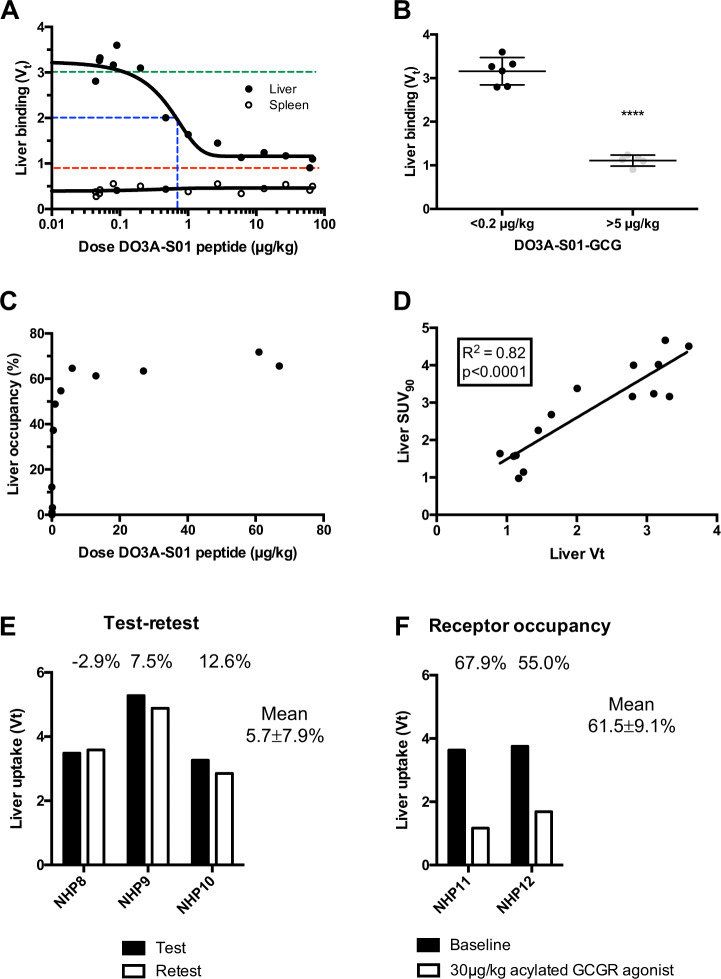
Figure 4.
Logan graphical analysis of [68Ga]Ga-DO3A-S01-GCG binding. Logan derived Vt in the liver and spleen plotted against co-injected DO3A-S01-GCG peptide mass dose (A), where the green dotted line indicates <5% occupancy i.e. negligible mass effect, the blue dotted line indicates in vivo Kd, the red dotted line indicates the background. Co-injected peptide doses >5 µg/kg strongly and consistently decreased the liver binding of [68Ga]Ga-DO3A-S01-GCG compared to administration of doses with negligible mass effect. (B) Occupancy incurred by co-injected amount of DO3A-S01-GCG peptide mass dose. (C) Correlation between Logan derived Vt and SUV90min in the liver (D). ****Indicates p < 0.0001. Test-retest variability of [68Ga]Ga-DO3A-S01-GCG binding in the liver over the course of an experimental day. (E) Effect on [68Ga]Ga-DO3A-S01-GCG binding in the liver by pre-treatment with 30 µg/kg of the acylated GCGR agonist 1-GCG (F).

