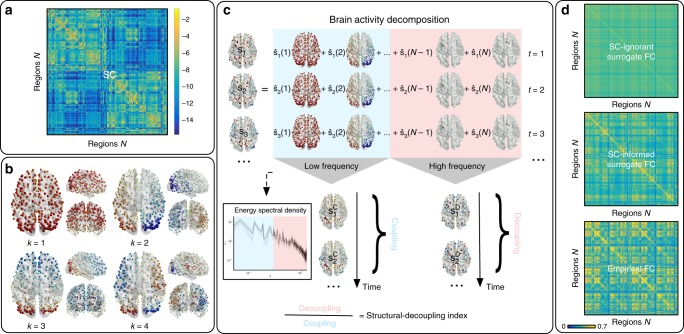
Fig. 1.
Method pipeline. a Structural connectome (SC) between atlas regions, displayed in logarithmic scale. b SC eigendecomposition leads to structural harmonics with increasing spatial frequency . c Brain activity at every time point () is written as a linear combination of harmonics (by using coefficients ). The median-split criterium on the activity energy spectral density (inset) is used to split the spectrum and decompose brain activity into coupled/decoupled portions and (using low/high-frequency harmonics, respectively; = harmonic frequency). The ratio between decoupled/coupled signal norms is defined as structural-decoupling index. d Surrogate functional signals are generated with/without knowledge of SC, by spectral coefficient randomization. Average functional connectomes (FC) obtained from correlating pairs of empirical/surrogate functional signals are compared

