Fig. 4.
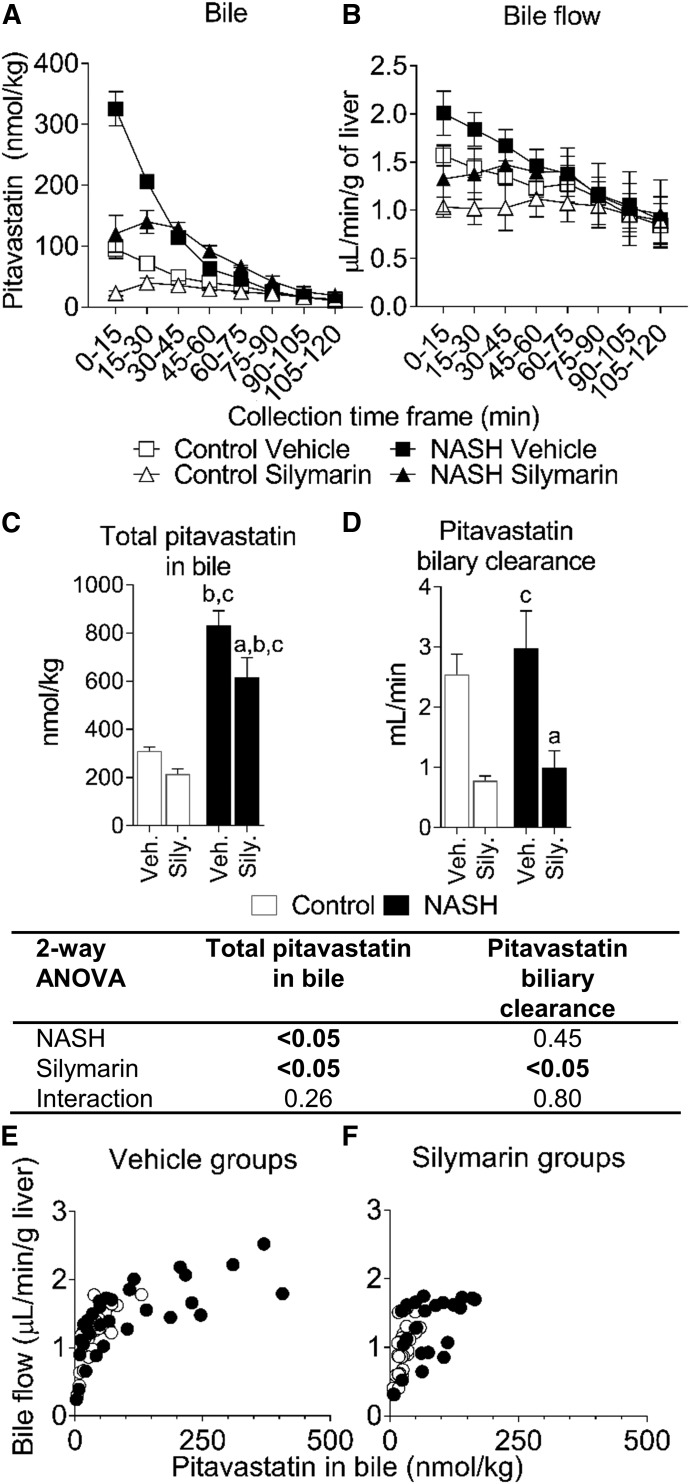
Biliary excretion of pitavastatin in control and NASH rats with or without silymarin. Amount of pitavastatin recovered in bile for each collection interval (A). Bile flow for each collection interval (B). Total pitavastatin recovered in bile (C) and pitavastatin biliary clearance (D). Data in (A–D) represent mean and S.E.M. of three rats for the NASH silymarin group and of four rats for all other groups. Relationship between bile flow and amount of pitavastatin for the vehicle-treated (E) and silymarin-treated (F) groups. Open circles and closed circles denote individual control and NASH rats, respectively. Two-way ANOVA P values are shown in the tables below the respective datasets. Tukey’s post-hoc test: a = P value ≤0.05 vs. respective vehicle group within each diet group; b = P value ≤0.05 vs. vehicle control; c = P value ≤0.05 vs. silymarin control.

