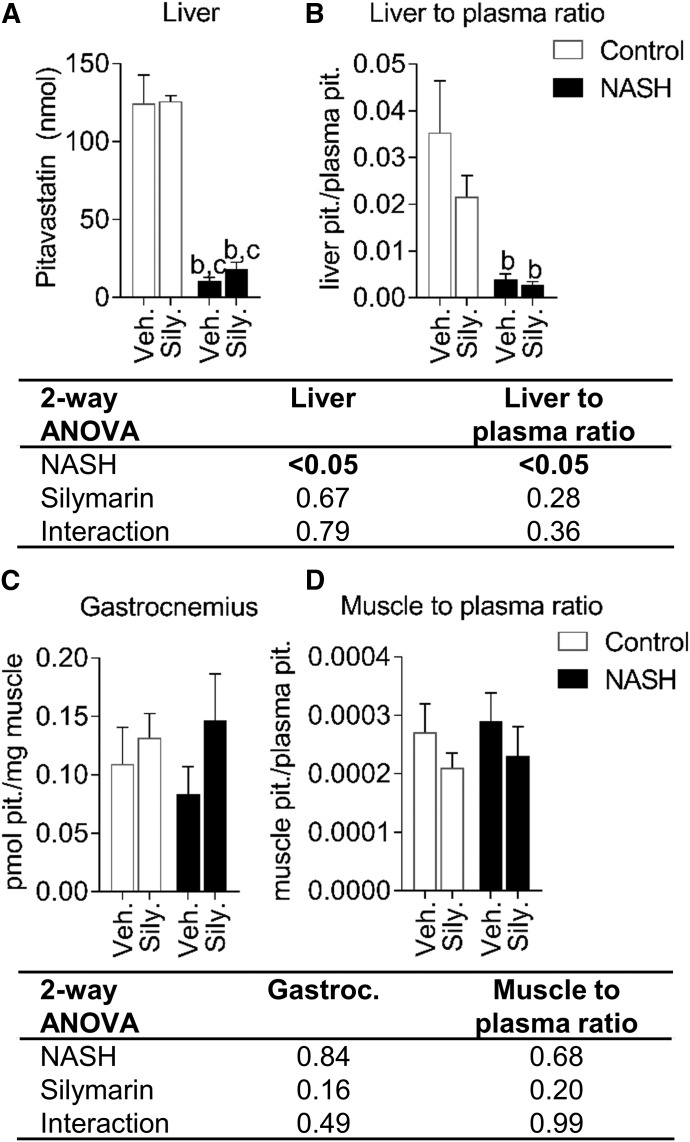
Fig. 5.
Tissue concentrations and tissue-to-plasma ratios of pitavastatin in control and NASH rats with or without silymarin. Liver pitavastatin content (A), pitavastatin liver-to-plasma ratio (B), gastrocnemius (leg muscle) pitavastatin concentrations (C), and pitavastatin muscle-to-plasma ratio (D) at 2 hours post-dose. Bars and error bars represent mean and S.E.M., respectively, of three rats for the NASH silymarin group and of four rats for all other groups. Two-way ANOVA P values are shown in the table. Tukey’s post-hoc test: b = P value ≤0.05 vs. vehicle control; c = P value ≤0.05 vs. silymarin control.

