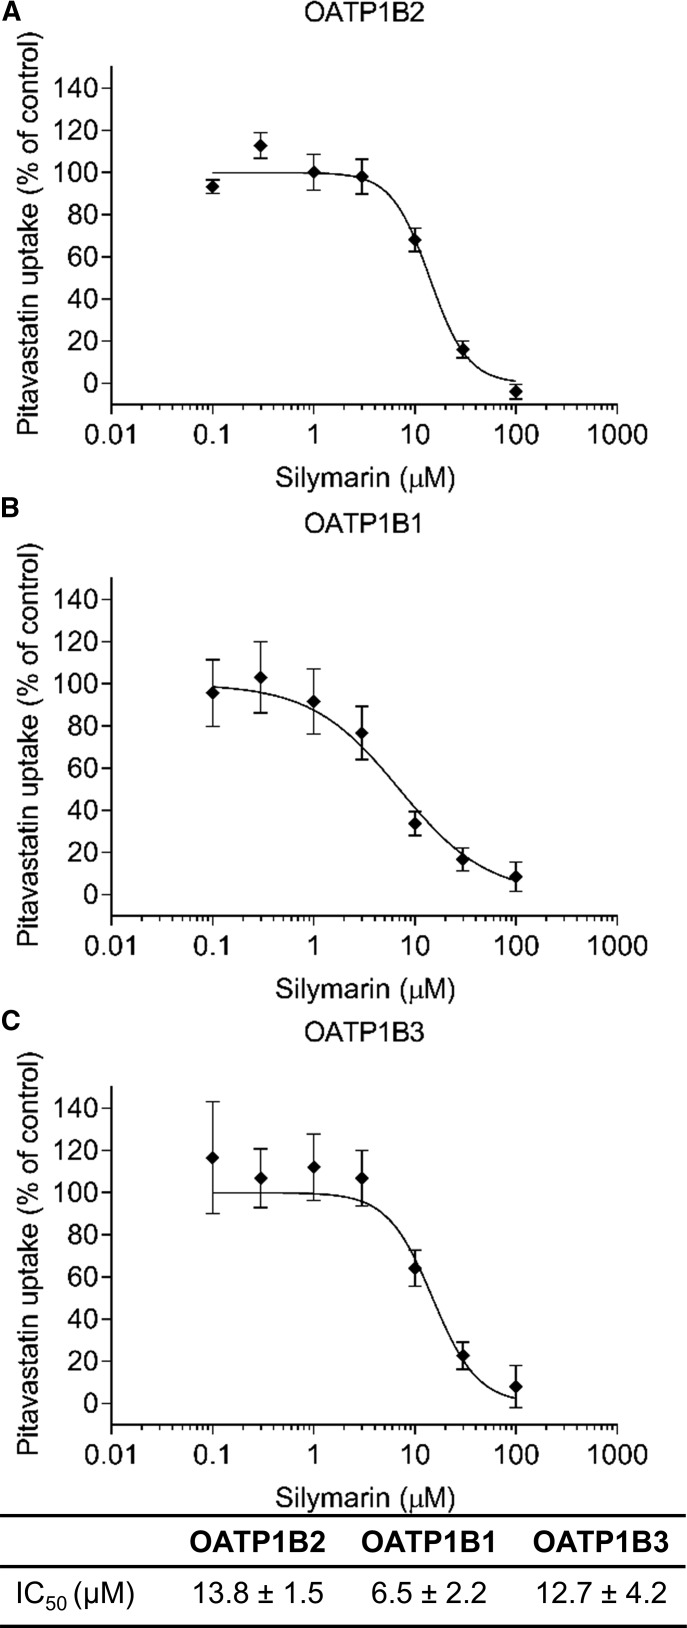
Fig. 7.
Silymarin inhibition of OATP1B2-, OATP1B1-, and OATP1B3-mediated uptake of pitavastatin. IC50 curves for OATP1B2 (A), OATP1B1 (B), and OATP1B3 (C) were obtained by measuring uptake of 1 μM pitavastatin for 3 minutes in the absence or presence of increasing silymarin concentrations. Symbols and error bars represent mean and S.E.M., respectively, of six replicates. Curves denote model-generated best fits to the data. IC50 values represent model-generated best-fit estimates ± S.E.’s of the estimates.

