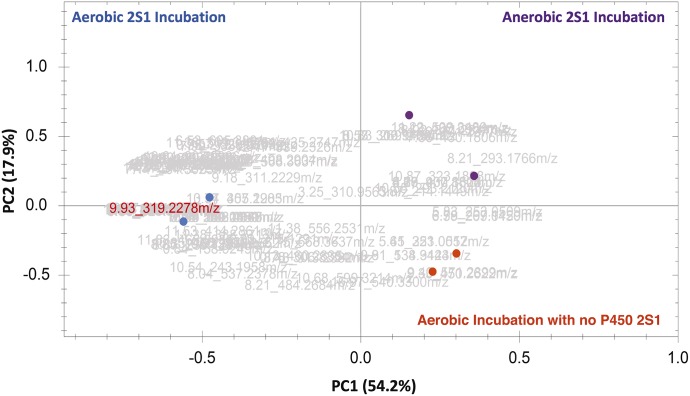
Fig. 1.
Principal component analysis score plot showing separation between the three tested groups (n = 2). The loading plots showed 124 features in light gray (tR and m/z pairs) that were responsible for the clustering. The feature highlighted in red lettering is a m/z 319.2278 peak eluted at 9.93 minutes that was verified by isotopic labeling and identified later as 19-HETE.

