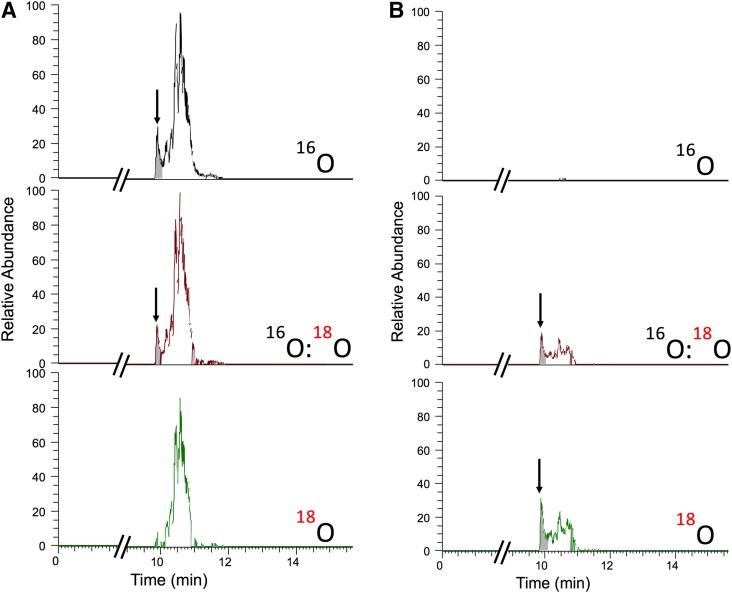
Fig. 2.
LC–high resolution mass spectrometry chromatograms of rat tissue extract incubated with human P450 2S1 enzyme and a NADPH-generating system. (A) Extracted ion chromatogram of m/z 319.2278 due to 16O2 incorporation; (B) extracted ion chromatogram of m/z 321.2320 due to 18O2 incorporation. The peak for 19-HETE at tR 9.9 is indicated with an arrow and shading. The scales of the chromatograms shown in (A and B) are identical (4.6 E6 full scale).

