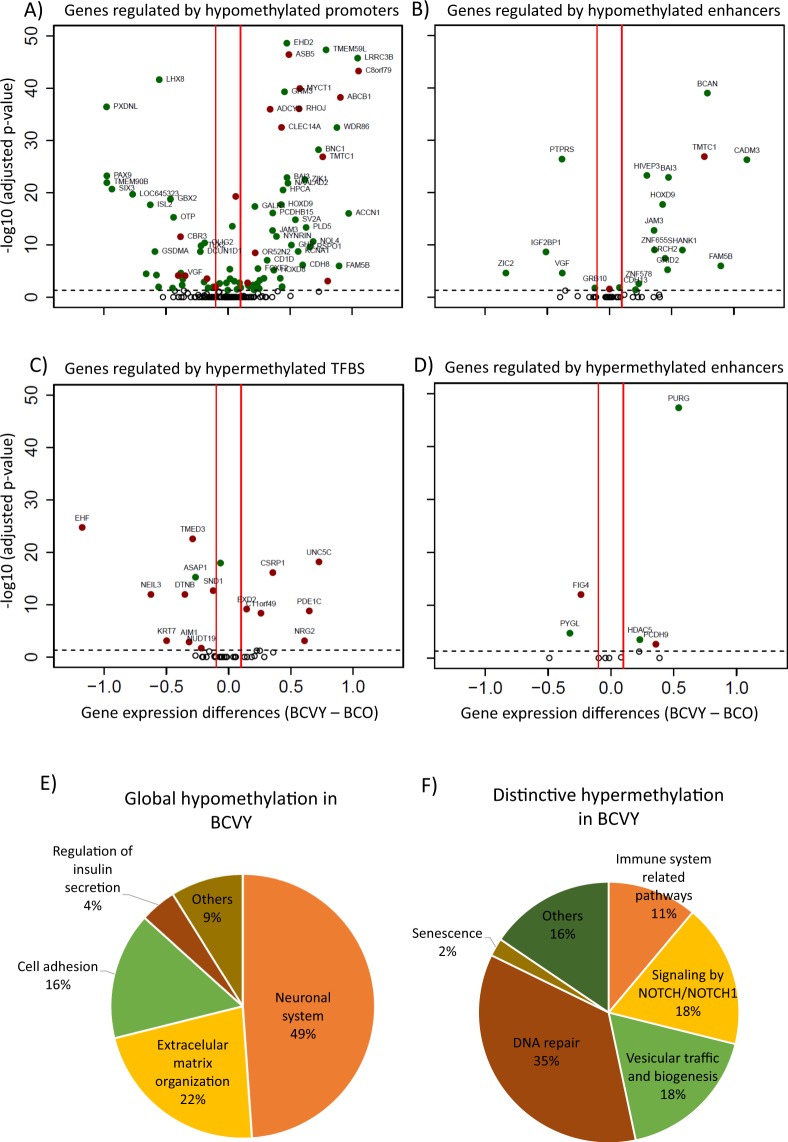
Figure 4.
TCGA expression for genes regulated by significantly different methylated CpG sites and pathway enrichment analysis. Genes regulated by differently methylated CpG sites from global BCVY hypomethylation profile found in metEPICVal samples localized in promoters (A) and enhancers (B). Genes regulated by differently methylated CpG sites from distinctive BCVY hypermethylation signature found in metEPICVal samples localized to TFBS (C) and enhancers (D); Green dots represent genes regulated by hypomethylated CpG regulatory sites and red dots those regulated by hypermethylated CpG regulatory sites; Percentage of significant enriched signalling pathways associated to genes differently expressed and regulated by global hypomethylated CpG sites in BCVY (E) and regulated by distinctive CpG probes generally hypermethylated in BCVY (F). EMO: extracellular matrix organization; NOTCH: Signalling by NOTCH/NOTCH1; Cell-Cell: cell communication.

