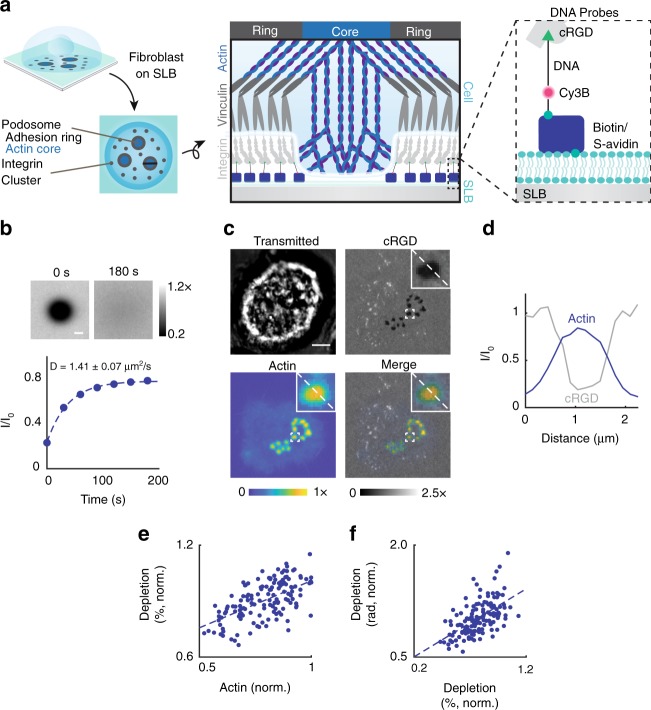
Fig. 1.
NIH 3T3 fibroblasts form protrusive podosomes on SLBs. a (Left) Schematic of the SLB podosome model. (Middle) Schematic of a single podosome at the cell–SLB interface across the black line. Podosomes exclude RGD-probes at their protrusive core. (Right) Zoomed-in schematic of a single DNA probe. b Representative images and mean intensity plot of RGD–DNA probes in a fluorescence recovery after photobleaching experiment. Data were normalized to the SLB intensity at t = 0 s. DNA probes had a diffusion coefficient of 1.41 ± 0.07 μm2 s−1 (mean + s.e.m., n = 9 FRAPs, 3 experiments). Scale bar, 10 µm. c Representative podosome-forming cell on an SLB decorated with single-stranded DNA probes. Cells were transfected LifeAct to visualize actin cores. Scale bar, 5 μm. d Linescan analysis across the zoomed-in podosome in c. cRGD and actin intensity are normalized to the SLB background and the brightest pixel, respectively. e, f Scatter plots of actin intensity versus depletion (%) and depletion (%) versus depletion radius. All data were normalized by the brightest podosome per cell to account for varying LifeAct expression. (r = 0.657, 0.604, N = 161 podosomes, 23 cells, three experiments). Source data are provided as a Source Data file

