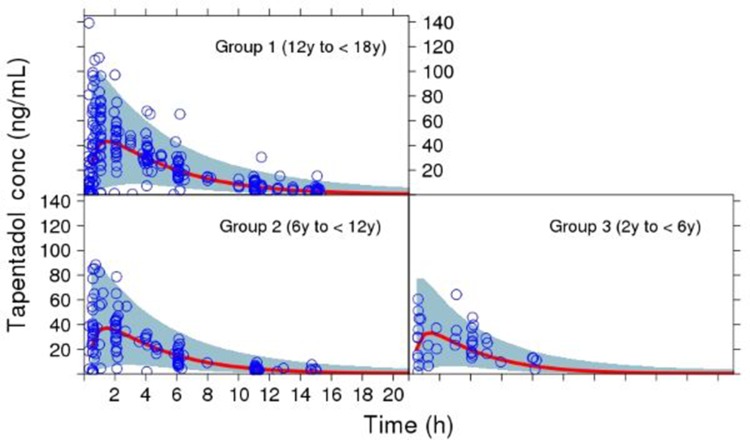
Figure 3.
Simulated concentration-time curve for the pediatric population (2 to <18 years) using final parameter estimates from the population pharmacokinetic model, showing the variability (blue area, representing the 95% prediction interval) and central trend (red line: median prediction), together with the observations (open circles).
Abbreviation: y, years.

