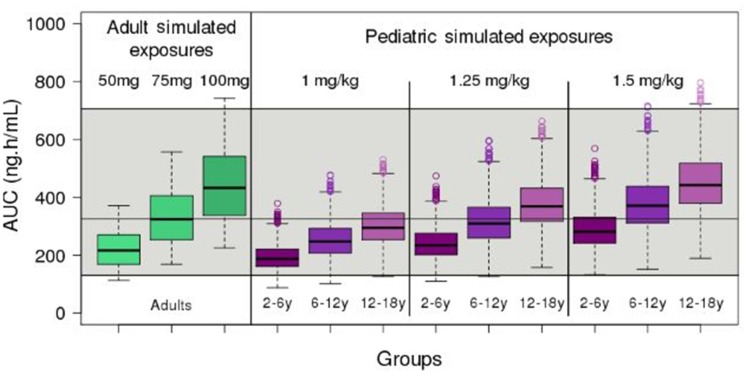
Figure 4.
Boxplot of the simulated steady-state area under the curve (AUCss) of tapentadol in adults and pediatric subjects 2 to <18 years of age receiving 1.0 mg/kg, 1.25 mg/kg, and 1.5 mg/kg of tapentadol every 4 hrs. The gray shaded area represents the 2.5th and the 97.5th percentile of the AUCss in adults receiving 50 mg and 100 mg tapentadol every 4 hrs, respectively. The central black line indicates the 50th percentile (median) of the AUC in adults receiving 75 mg tapentadol every 4 hrs.
Abbreviations: AUC, area under the curve; y, years.

