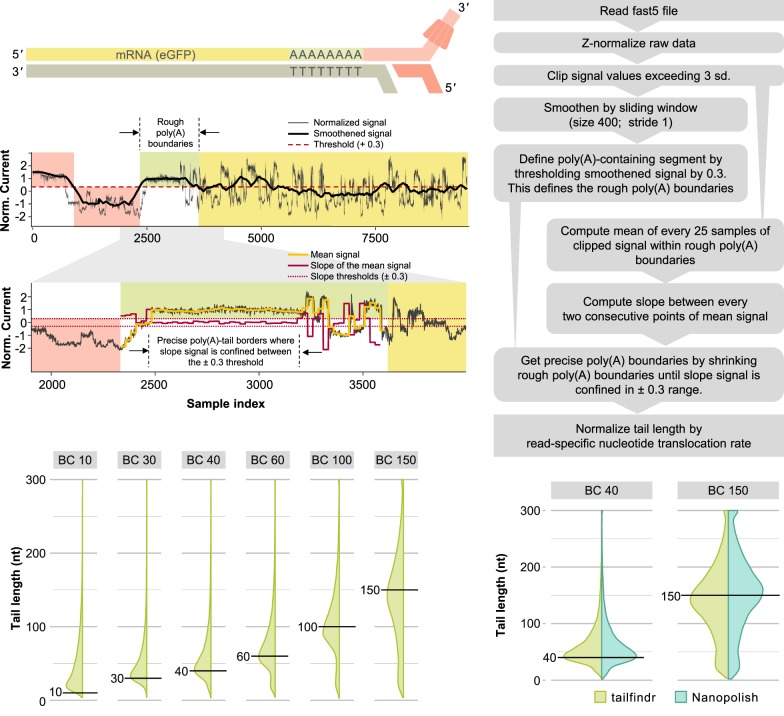
FIGURE 1.
Workflow and performance of tailfindr on ONT RNA data. (A) Schematic representation of Oxford Nanopore RNA sequencing. The motor protein (red) is attached to the native RNA molecule (yellow) at the 3′-end by T4 DNA ligation via a double-stranded adapter (light red) with oligo-T overhang. The motor protein thus feeds the RNA strand to the pore from 3′ to 5′. (B) Representative signal tracks from eGFP-RNA sequencing. Upper panel shows normalized signal data calculated by z-normalization through tailfindr (gray, workflow box 3) with smoothened signal track (black, workflow box 4). Red background indicates ONT adapter signal and green background represents rough borders of poly(A) signal as identified by thresholding (workflow box 5), whereas yellow background highlights signal corresponding to potential RNA sequence. Lower panel shows zoom on potential poly(A) region with signal track for the mean of clipped, normalized raw data (yellow, workflow box 6) and slope of the mean signal track (red, workflow box 7), which are used to refine poly(A) boundaries (dashed vertical lines, workflow box 8). (C) Schematic workflow of data processing by the tailfindr algorithm for ONT native RNA sequencing data leading to signal tracks shown in B and ultimately poly(A) estimation. (D) Vertical density plots of poly(A) length estimation on in vitro transcribed eGFP-RNA molecules with known poly(A) tail length (from left to right: 10, 30, 40, 60, 100, and 150 nt labeled as BC10, BC30, BC40, BC60, BC100, and BC150, respectively). Horizontal black lines demarcate expected poly(A) length for individual barcodes. Poly(A) estimates exceeding 300 nt were set to 300 prior to plotting. (E) Vertical density plots of poly(A) length estimation from tailfindr (light green) and Nanopolish (turquoise) on in vitro transcribed eGFP-RNA with poly(A) length of 40 or 150 nt (labeled as BC40 and BC150, respectively). Poly(A) estimates exceeding 300 nt were set to 300 prior to plotting. Comparison of all known poly(A) lengths can be found in Supplemental Figure S2B.

