FIGURE 3.
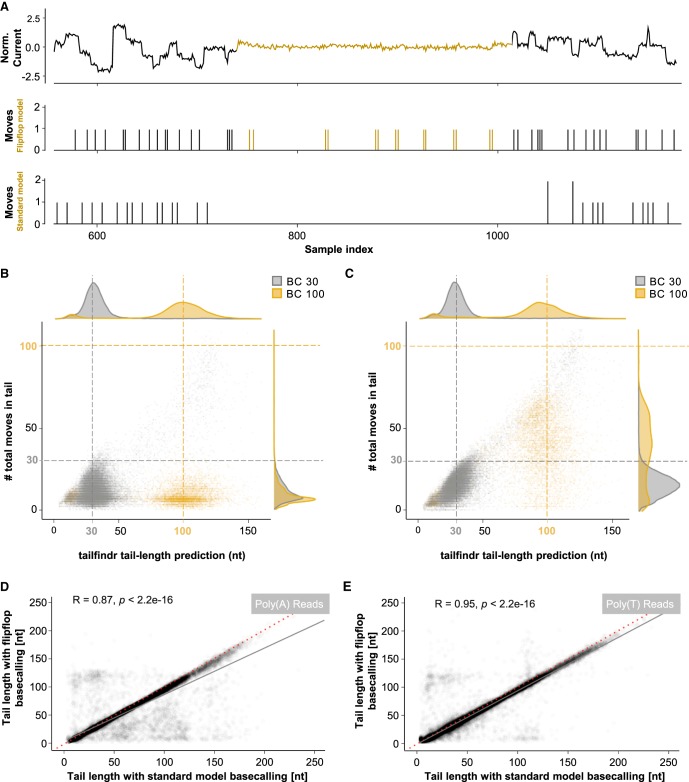
Differences in poly(A) tail estimation for standard and flip-flop model base-calling. (A) Representative raw data squiggle of PCR-amplified eGFP coding sequence over the identified poly(A) tail region (colored yellow) with associated moves (shifts in raw data representing possible nucleotide translocations) in both flip-flop (middle panel) and standard model base-calling (bottom panel). Flip-flop model base-calling detects moves with higher resolution, and calls more moves, especially in the poly(A) tail region (yellow). (B,C) Scatter plot of estimated poly(A)/(T) tail length (x-axis) and moves detected with standard (B) or flip-flop model base-calling (C) on PCR-amplified eGFP coding sequence with poly(A) length of 30 nt (gray) and 100 nt (yellow). Colored dashed lines indicate expected poly(A) length. (D,E) Scatter plot of poly(A) (D) or poly(T) (E) tail length estimated from PCR-amplified eGFP coding sequence with different poly(A) tail lengths that were base-called either with standard (x-axis) or flip-flop models (y-axis). (R, p by Pearson correlation). Red dashed line indicates x = y; gray line indicates linear fit.

