FIGURE 3.
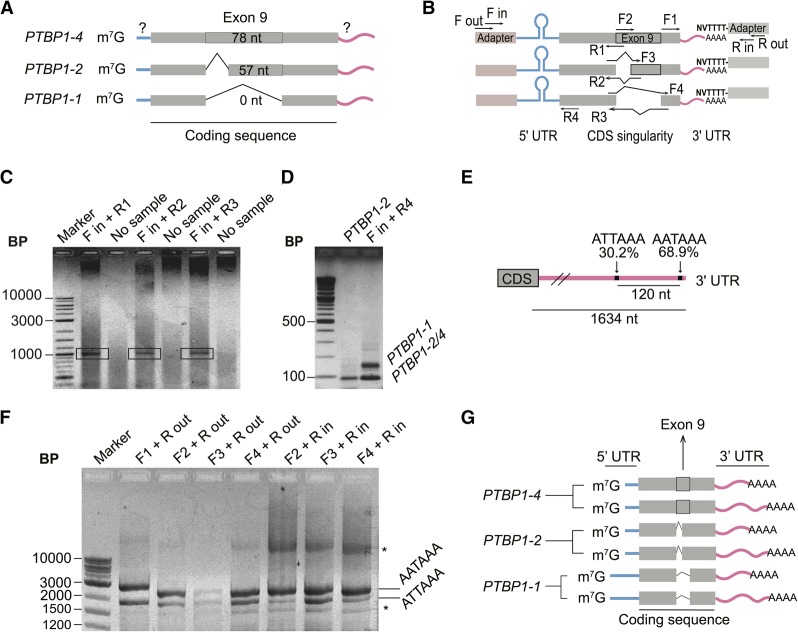
Mapping of the UTR elements of PTBP1 mRNAs. (A) Scheme of the composition of the 5′-UTR of PTBP1 transcripts according to the coding sequence content, with question marks indicating the regions to be mapped. (B) Design of RLM-RACE experiments performed to determine the relationship between 3′-UTR elements, exon 9 boundaries, and 5′-UTR elements in PTBP1 mRNAs. (C) Agarose gel of final PCR reaction for the 5′-UTR RLM-RACE. Bands in the black rectangles were extracted for sequencing. (D) Agarose gel showing the presence of two known and mapped 5′-UTR lengths during RLM-RACE, using primers that anneal to all three PTBP1 isoforms. PTBP1-2 sequence was used as a control. (E) Representation showing high usage polyadenylation sites on PTBP1 mRNA 3′-UTR (not to scale). Data from You et al. (2015). (F) Agarose gel of PCR reactions following RLM-RACE to identify the polyadenylation sites of PTBP1 transcript isoforms. (*) Unidentified bands that only appear after second round of PCR. (G) Model for major PTBP1 transcript isoforms in HEK293T cells based on experimental observations. Blue bars, evidence for the existence of two lengths of the 5′-UTR; pink bars, evidence that each transcript has at least two alternative polyadenylation sites, resulting in a long or short 3′-UTR. Gray thick bar represents the alternatively spliced isoforms involving exon 9.

