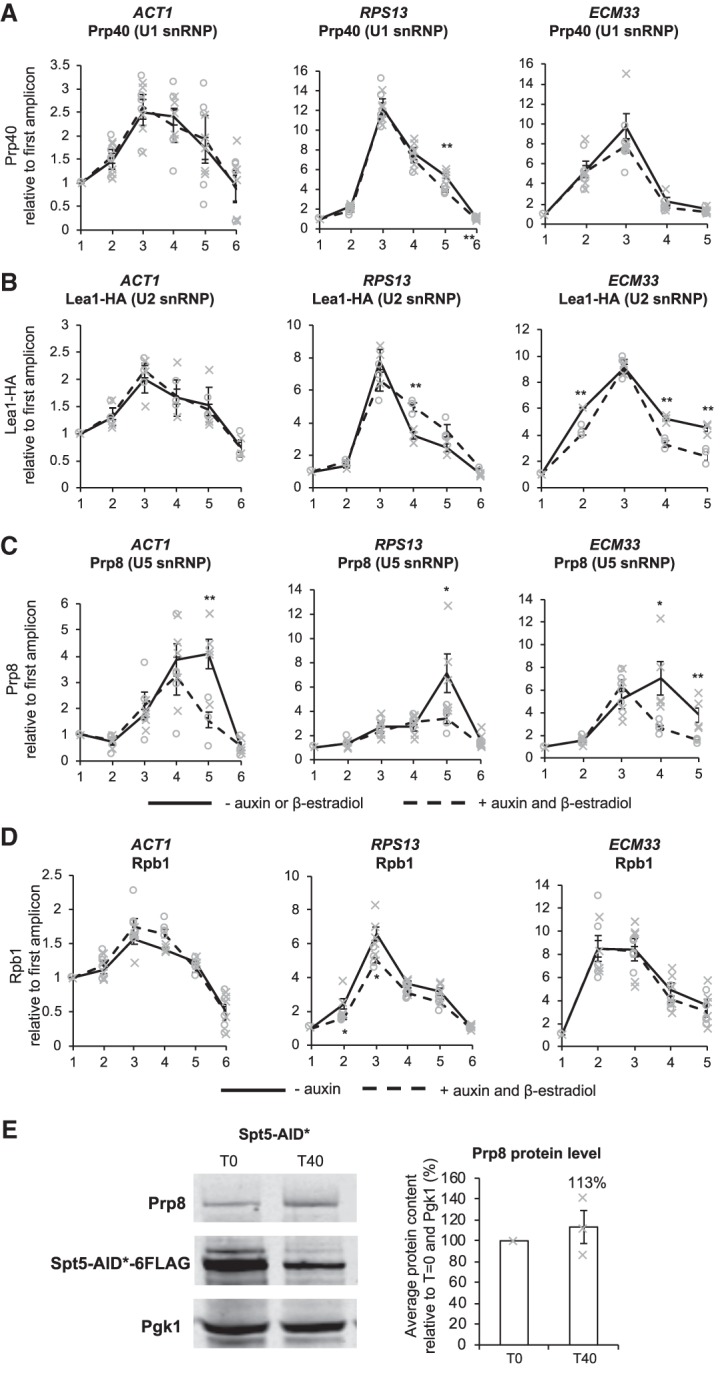
FIGURE 2.

Depletion of Spt5 reduces cotranscriptional recruitment of U5 snRNPs. (A) Anti-Prp40 (U1 snRNP), (B) anti-Lea1-HA (U2 snRNP), (C) anti-Prp8 (U5 snRNP), and (D) anti-Rpb1 (RNAPII) ChIP and qPCR across intron-containing genes ACT1, RPS13, and ECM33 without auxin or β-estradiol (solid black line) and with 40 min of auxin and β-estradiol treatment to deplete Spt5-AID* (dashed black line). The x-axes show the amplicons used for ChIP-qPCR analysis (see Fig. 1B). The ChIP data are presented as the mean percentage of input relative to the first amplicon of each gene for at least three biological replicates. Error bars, standard error of the mean. Gray crosses indicate the individual replicate values without auxin and β-estradiol and gray circles indicate the individual replicate values 40 min after auxin and β-estradiol addition. (E) Western blot probed with anti-Prp8 (U5 snRNP), anti-Flag, and anti-PGK1 as a loading control. T0, samples taken before, and T40, 40 min after addition of auxin and β-estradiol. Quantification of Prp8 is presented as the percentage mean of three biological replicates for T40 samples relative to T0 values and normalized to the PGK1 signal. Error bars, standard error of the mean. Asterisks show the statistical significance (Student's unpaired t-test). (*) P < 0.05, (**) P < 0.01, and (***) P < 0.001. Not significant, P > 0.05. Gray crosses indicate the individual replicate values.
