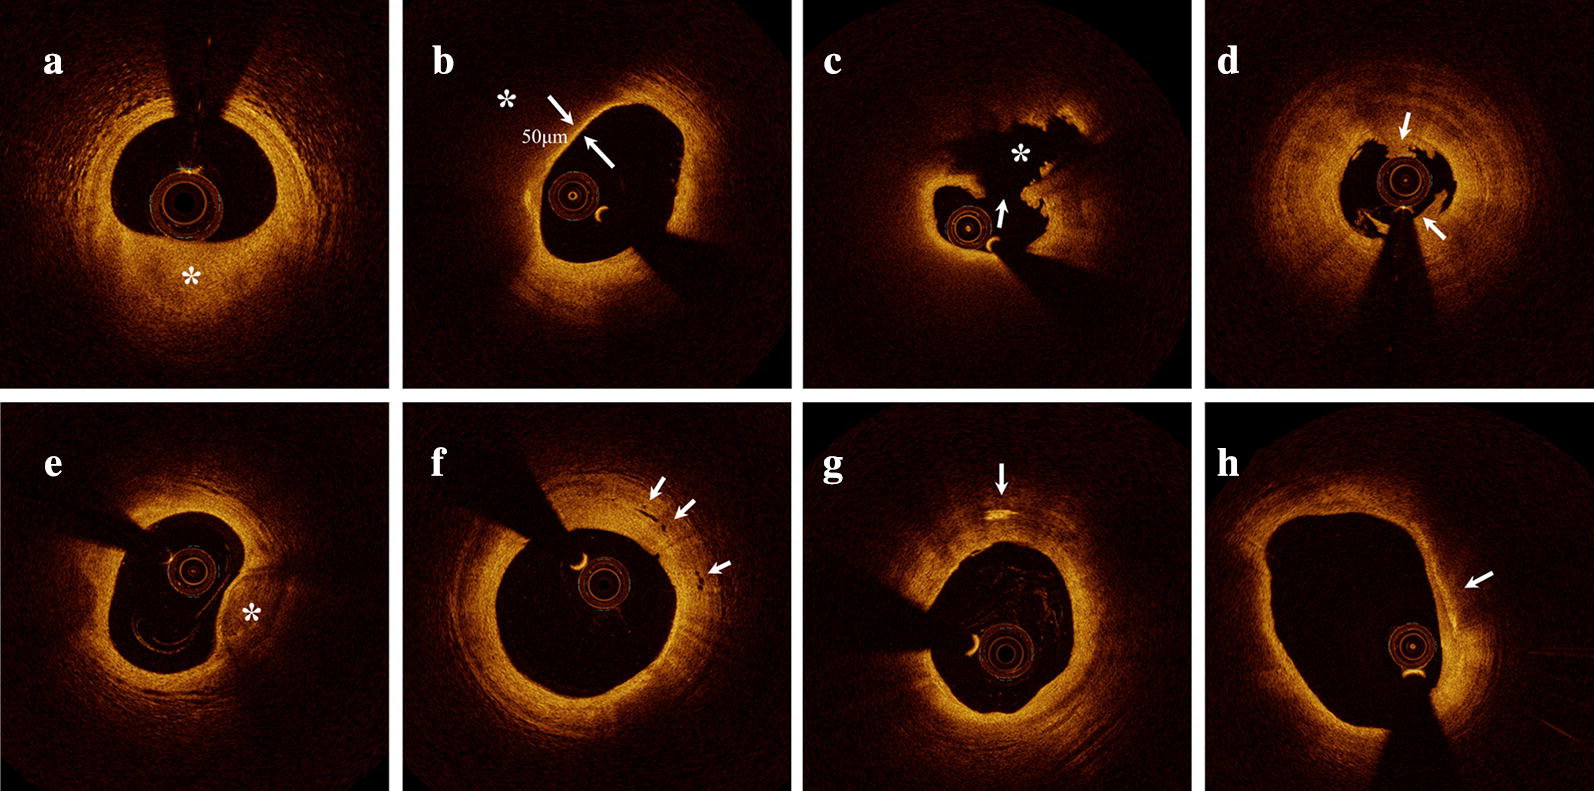
Fig. 1.

Representative cross-sectional optical coherence tomography images. a Fibrous plaque identified as a homogeneous, highly backscattering region (asterisk). b Lipid-rich plaque identified as a low-signal region with a diffuse border (asterisk) and thin-cap fibroatheroma with fibrous-cap thickness of 50 μm. c Plaque rupture identified by disruption of the fibrous cap (arrow) and cavity formation (asterisk). d Plaque erosion identified by the presence of attached thrombus (arrow) overlying an intact plaque. e Calcification identified by the presence of a well-delineated, low-backscattering heterogeneous region (asterisk). f Microvessels defined as tubule luminal structures that do not generate a signal, with no connection to the vessel lumen (arrow). g Cholesterol crystal (arrow) identified by linear, highly backscattering structures without remarkable backward shadowing. h Macrophage infiltration (arrow) defined as a signal-rich, distinct or confluent punctate region of higher intensity than background speckle noise that generates remarkable backward shadowing
