FIGURE 3.

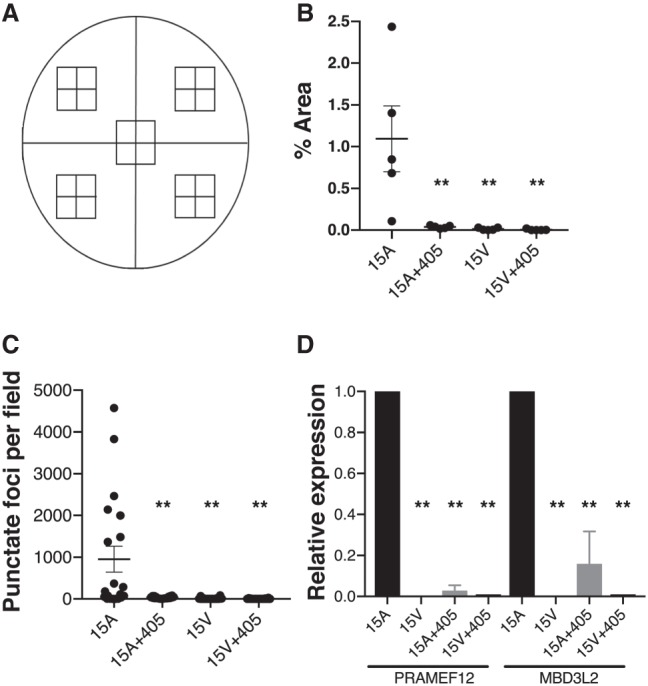
Quantification of DUX4 RNAscope signal and DUX4-activated biomarkers. (A) Schematic representation of a cover slip on which FSHD and control myoblasts were grown and differentiated to myotubes. For each sample, a total of 20 image fields were taken from five zones (four quadrants and one central zone). DUX4 RNAscope signal was quantified as demonstrated in the video in Supplemental Figure 2. (B) Percent area of DUX4 signal in one representative experiment (from three independent experiments). Each data point represents total % area per zone. In this experiment, DUX4 signal was significantly elevated in 15A myotubes compared to unaffected 15V controls and to 15A cells transfected with the mi405 therapeutic microRNA. (**) Represents significant differences from untreated 15A FSHD cells (P < 0.01; ANOVA). (C) Data presented here indicate that despite low abundance relative to the entire 15A culture, the ∼1% of cells showing DUX4 signal often expressed high amounts of DUX4 mRNA. Here, each data point represents the number of DUX4 positive foci per field in a representative culture. One DUX4 focus was defined as 16 pixels, which was the minimum visible DUX4 signal. Again, DUX4 signal was absent or very low in unaffected 15V cells, as well as affected 15A cells transfected with mi405 plasmid. (**) Represents significant differences from untreated 15A myotubes (P < 0.01; ANOVA). (D) QPCR assays of DUX4-activated biomarkers, PRAMEF12 and MBD3L2, in 15A and 15V cells. Biomarker expression was used to confirm the specificity of the RNAscope assay and knockdown of endogenous DUX4 by miDUX4.405. Both biomarkers were significantly elevated in affected 15A myotubes, but absent or virtually absent in 15V cells (no signal at cycle 40). PRAMEF12 and MBD3L2 were significantly reduced in 15A cells transfected with miDUX4.405 plasmid. Data were acquired from N = 3 independent experiments, with each QPCR assay performed in triplicate. (**) Represents significant differences from untreated 15A myotubes (P < 0.01; ANOVA).
