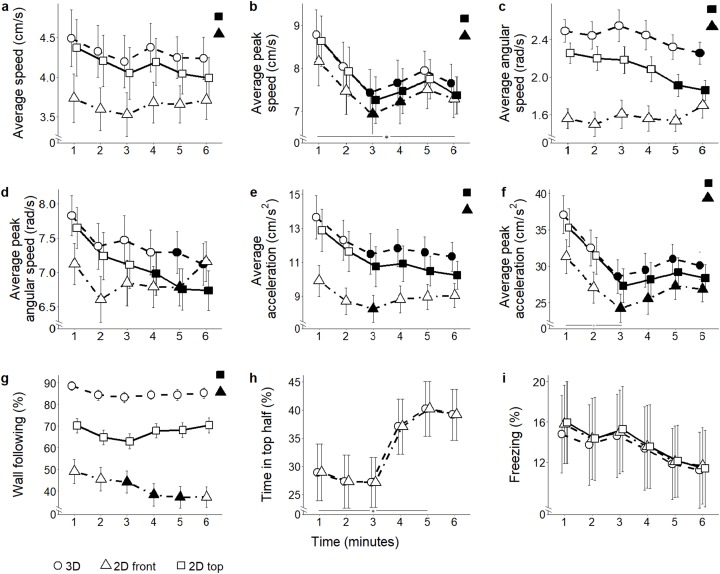
Figure 5. Behavioral parameters for the ethanol conditions.
Mean ± standard error for (A) average speed (B) average peak speed (C) average angular speed (D) average peak angular speed (E) average acceleration (F) average peak acceleration (G) proportion of time spent within three cm of walls (H) proportion of time spent in the top half of the tank, and (I) proportion of time spent freezing, over 6-min trials aggregated for all ethanol conditions, computed from 2D front and top views, and 3D reconstructed trajectories. Data were analyzed through a repeated measures ANOVA for split-plot designs. Filled symbols denote a significant difference (P < 0.05) from the first minute within each condition. Horizontal bar denotes a significant overall difference over time. Filled symbols in the top right corner of each panel indicate a significant overall difference with respect to 3D data.

