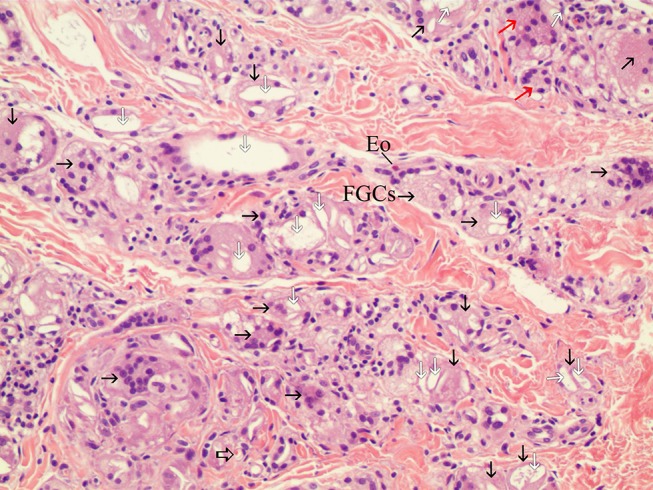
Figure 7.

200× magnification on the left area of Figure 5 (H&E stain). Particles smaller than 20 microns were assumed to be particles that were injected 7 months before the biopsy and demonstrated late stage of inflammation in tissue reaction. FGCs (black arrow) ingested and cleaved CaHA particles and showed CaHA biodegradation. FGCs always positioned between new collagen fibers and CaHA particles (white arrows). The nuclei were centrally placed and overlapped each other in most FGCs. In some FGCs, ingested CaHA particles had displaced nuclei of FGCs peripherally. But in a few giant cells, the nuclei were arranged on the border as horseshoe shape like Langhans giant cell (red arrow). New vessels (empty black arrows) with a red blood cell its inside was visible and and demonstrated neovascularization by CaHA filler. A eosinophil (Eo) was found.
