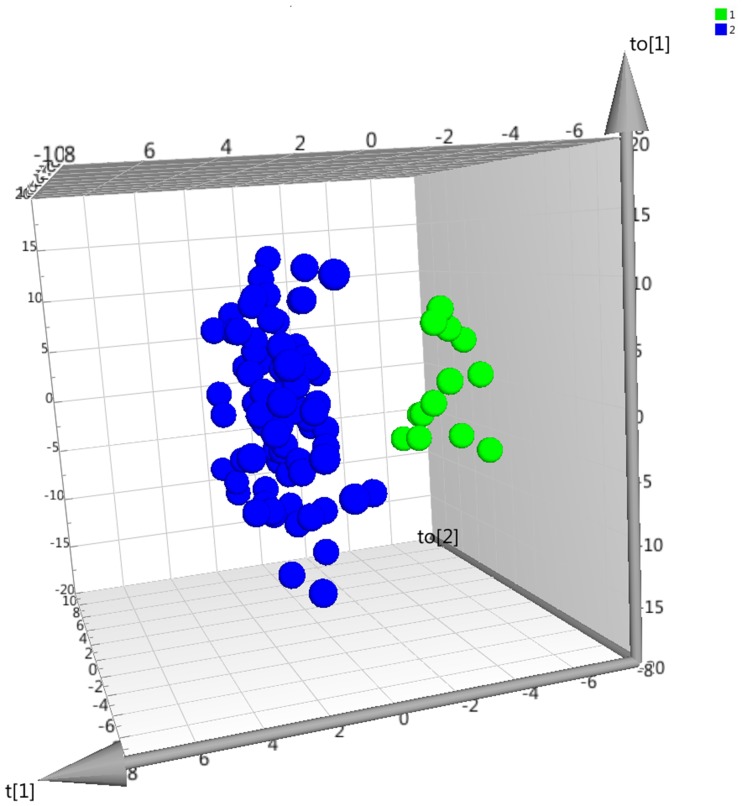
Figure 1.
Score plot of multivariate model discriminating neuropathic pain patients and controls. Visualization of the first three latent variables from OPLS-DA model 1, neuropathic pain patients (NP1, green dots) vs controls (C1, blue dots). The t[1] axis represents interclass variation, whereas the two other two axes (to[1] and to[2]) represent intra-class variation.

