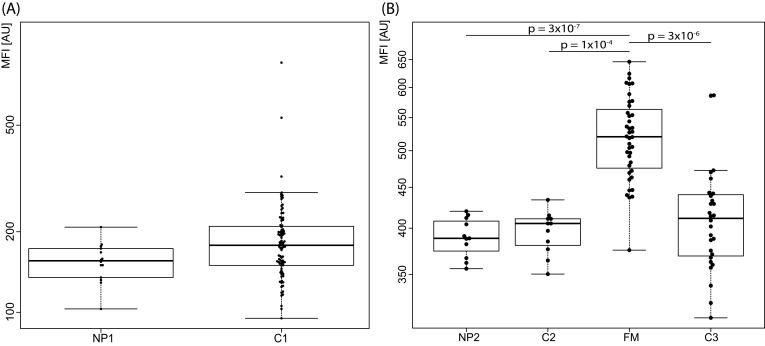
Figure 3.
CSF levels of ENPP2 in (A) neuropathic pain patients (NP1) compared to controls (C1) in the first stage and (B) for neuropathic pain patients (NP2) and fibromyalgia (FM) compared to controls (C2 and C3) in the second analysis stage. Significant differences are indicated with p-values. MFI – median fluorescence intensity.

