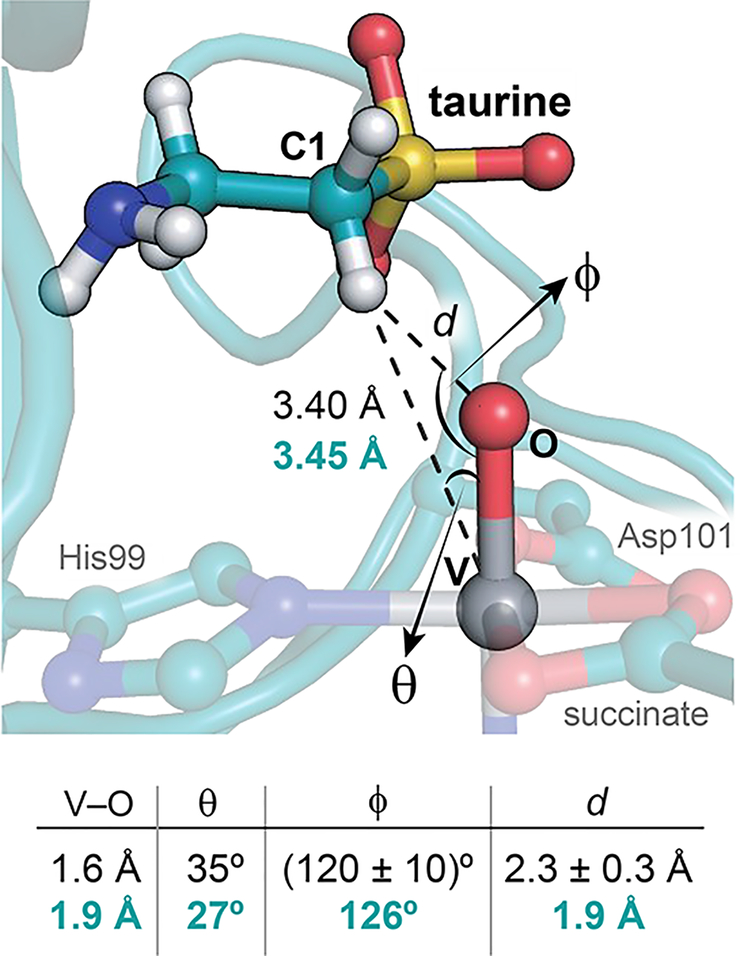
Figure 3.
Comparison of crystallographic and spectroscopic models of the ferryl mimic. Key bond angles and distances derived from HYSCORE/EXAFS (black)12 are juxtaposed to those from the chain B active site (turquoise). Depicted hydrogens were added in standard geometries using phenix.reduce.

