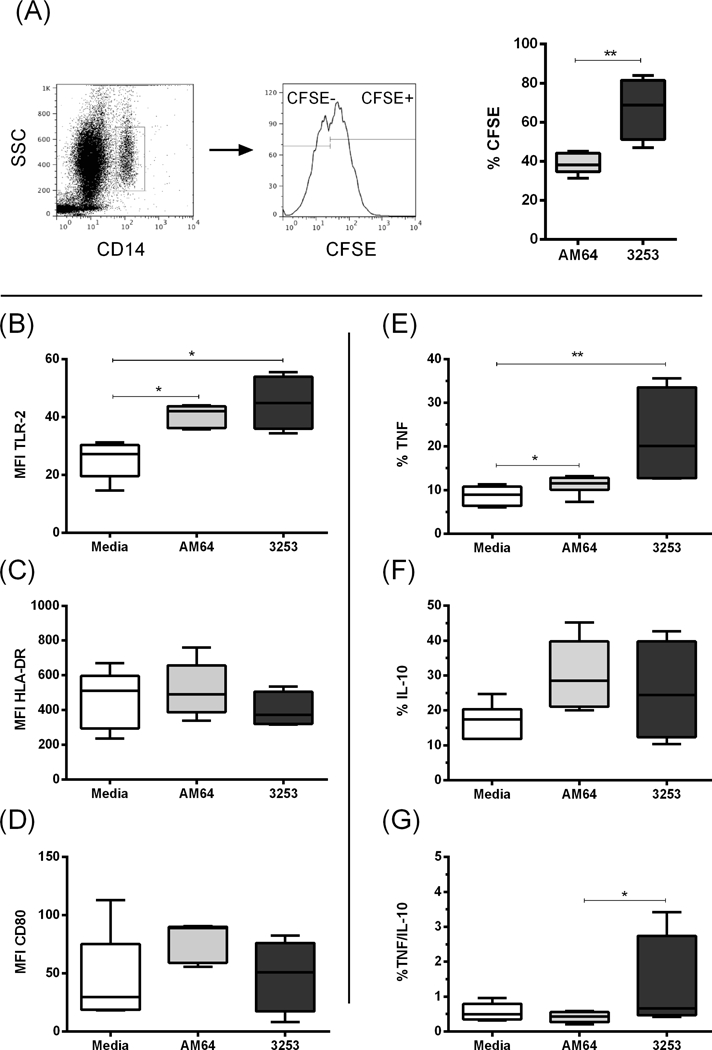
Figure 1: Monocyte single infection with CFSE-labeled trypomastigotes from AM64 (Tc IV) and 3253 (Tc V) strains.

Total human blood samples from non-Chagas donors were cultured for 15 hours with either AM64 or 3254 trypomastigotes previously labeled with CFSE, and monocyte population was analyzed by flow cytometry as described in the materials and methods section. (A) First panel shows representative dot plot of CD14 expression versus granularity (SSC), indicating the selection of monocytes (CD14high). Second plot shows representative histogram for selection of CFSE+ monocytes. Graphs are gated in infected CFSE+ monocytes, and the % of CFSE+ cells exposed to the different strains are shown in the third graph. (B) Mean fluorescence intensity (MFI) of TLR-2 expression in CFSE+ monocytes; (C) MFI of HLA-DR expression in CFSE+ monocytes; (D) MFI of CD80 expression in CFSE+ monocytes; (E) Percentage of TNF+ in CFSE+ monocytes; (F) Percentage of IL-10 in CFSE+ monocytes and (G) Percentage of TNF/IL-10 ratio in CFSE+ monocytes. White boxes represent total blood incubated with media; grey and black boxes represent blood incubated in the presence of CFSE-labeled AM64 or 3253 trypomastigotes, respectively. Results are expressed as box and whisker plots showing minimum and maximum values. Comparison between groups were performed with using Kruskal-Wallis test as described in material and methods section. *p<0.05, **p<0.01
