
Figure 3: Intensity of expression of TLR-2, HLA-DR and CD80 by human monocytes single- and co-infected with trypomastigotes from AM64 and 3253 strains after 15 or 72 hours of infection.
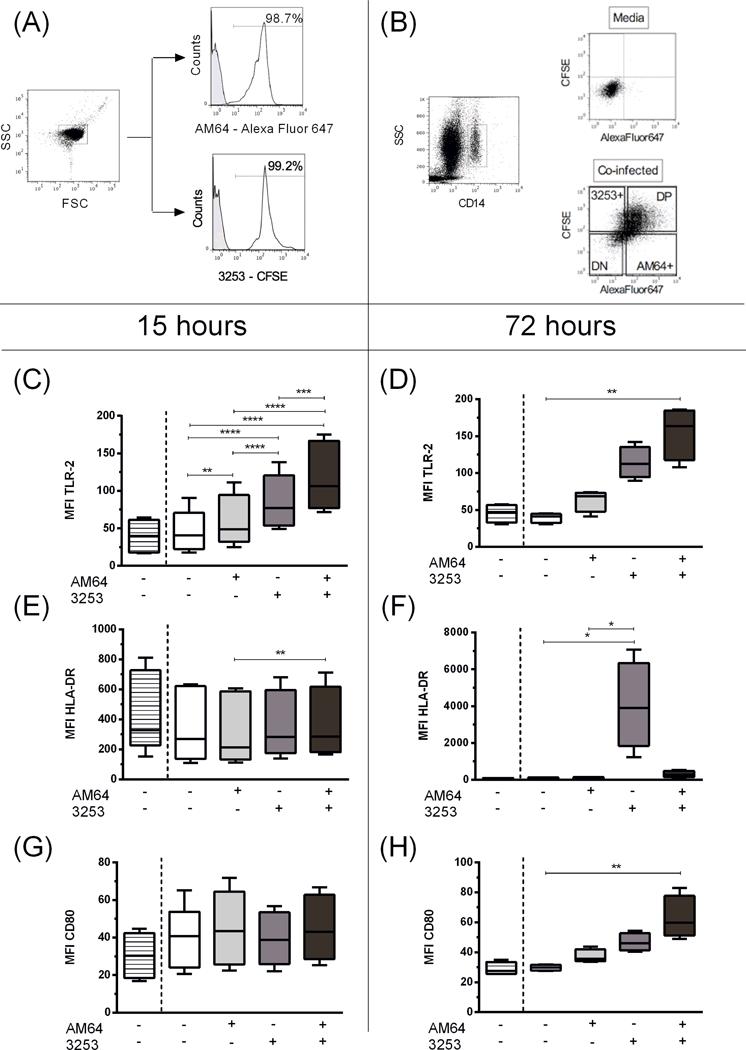
Trypomastigotes from AM64 and 3253 were stained with Alexa Fluor 647 and CFSE, respectively, and co-cultured for 15 or 72 hours with whole blood from healthy donors as described in material and methods. (A) shows representative plots of AlexaFluor 647- or CFSE-labeled trypomastigotes, indicating the selection of trypomastigotes in a forward (FSC) and side scatter (SSC) graph. In the histograms, the grey-shaded lines represent media control with no staining and white lines show representative staining for AM64 labeled with Alexa fluor 647 (top histogram) and 3253 labeled with CFSE (botton histogram); (B) Representative figure of gating strategy for the experiments with mixed infection. First plot shows the selection of monocytes that was performed in a similar way to the single-infection analysis (SSC versus CD14, selecting CD14high cells). After selection of monocytes, we divided the subpopulations of non-infected double negative monocytes (DN – AF647-CFSE-), AM64 single infection (AM64+: AF647+CFSE-), 3253 single infection (CFSE+: AF647-CFSE+), and double infected, double positive (DP - AF647+CFSE+) monocytes using the plot AF647 versus CFSE. Plots show representative selection of the four subpopulations in blood incubated with media and with both strains (top and bottom plot respectively). In graphs C-H striped box show media incubation, white, light grey, dark grey and black plot show DN, AM64 single infected, 3253 single infected and double-infected monocytes from incubation with AM64 and 3253 in the same tube. (C) Mean fluorescent intensity (MFI) of TLR-2 expression in monocytes after 15 hours of infection; (D) MFI of TLR-2 expression in monocytes after 72 hours of infection; (E) MFI of HLA-DR expression in monocytes after 15 hours of infection. (F) MFI of HLA-DR expression in monocytes after 72 hours of infection. (G) MFI of CD80 expression in monocytes after 15 hours of infection. (H) MFI of CD80 expression in monocytes after 72 hours of infection. Results are expressed in box and whisker plots showing minimum and maximum values. Comparisons between groups were performed with using Kruskal-Wallis test as described in material and methods section. *p<0.05, **p<0.01, ***p<0.001 and ****p<0.0001.